Follow every turn.
Navigate classified well sections in 3D. Switch between azimuth, inclination, curvature, tortuosity, and dogleg severity (DLS) to explore variation along the mapped wellbore.
Mouse navigation · Section colors · Zoom to well
North Dakota · A subsurface perspective
Find the orders on a North Dakota tract, follow surveyed wells underground, and see how their oil production changes over time.
A quick tour
Start with North Dakota, move below the surface, and explore well paths, operators, azimuth, DLS, spacing units, and township scenarios.
75 seconds On-screen captions
Watch on YouTubePress play to load the YouTube video. Captions only; no audio.
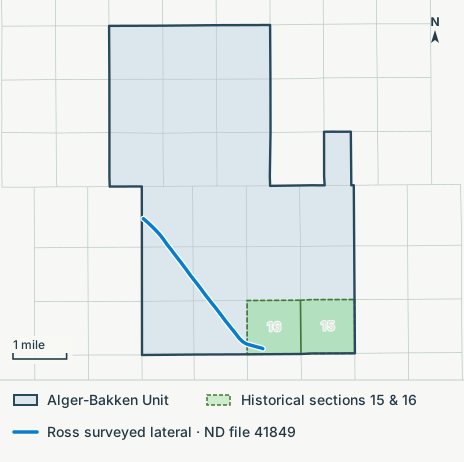
See how hearing orders create, change and end spacing units, and which surveyed wells sit inside them.
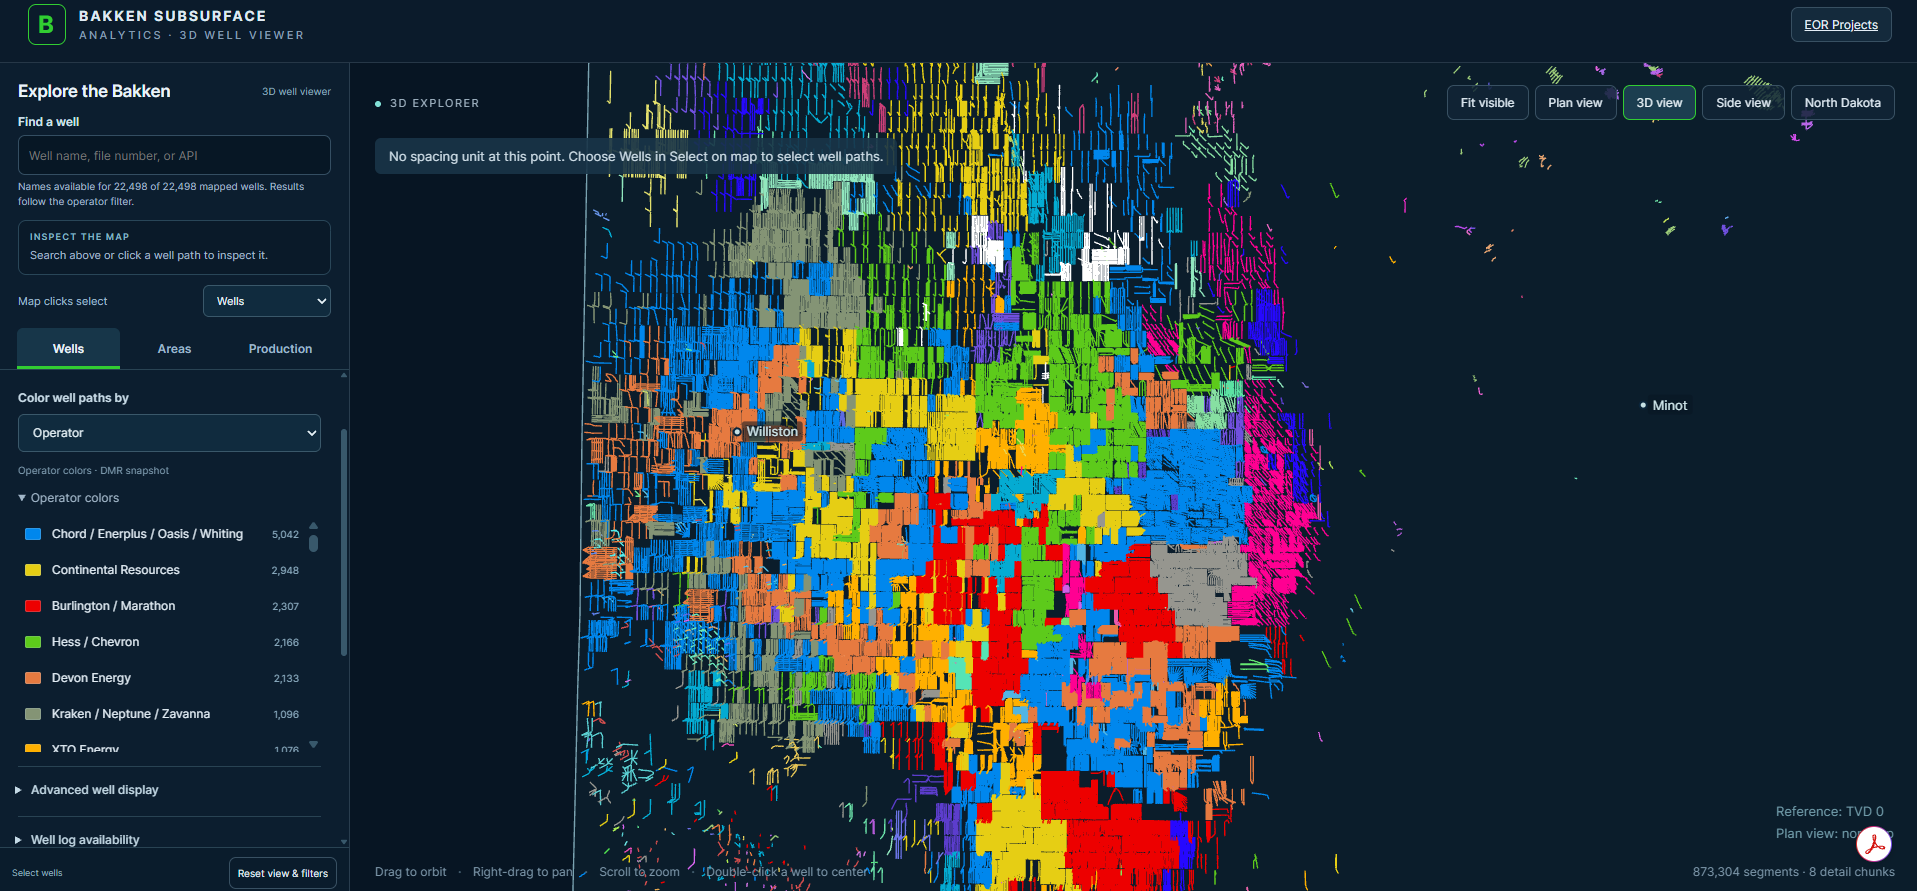
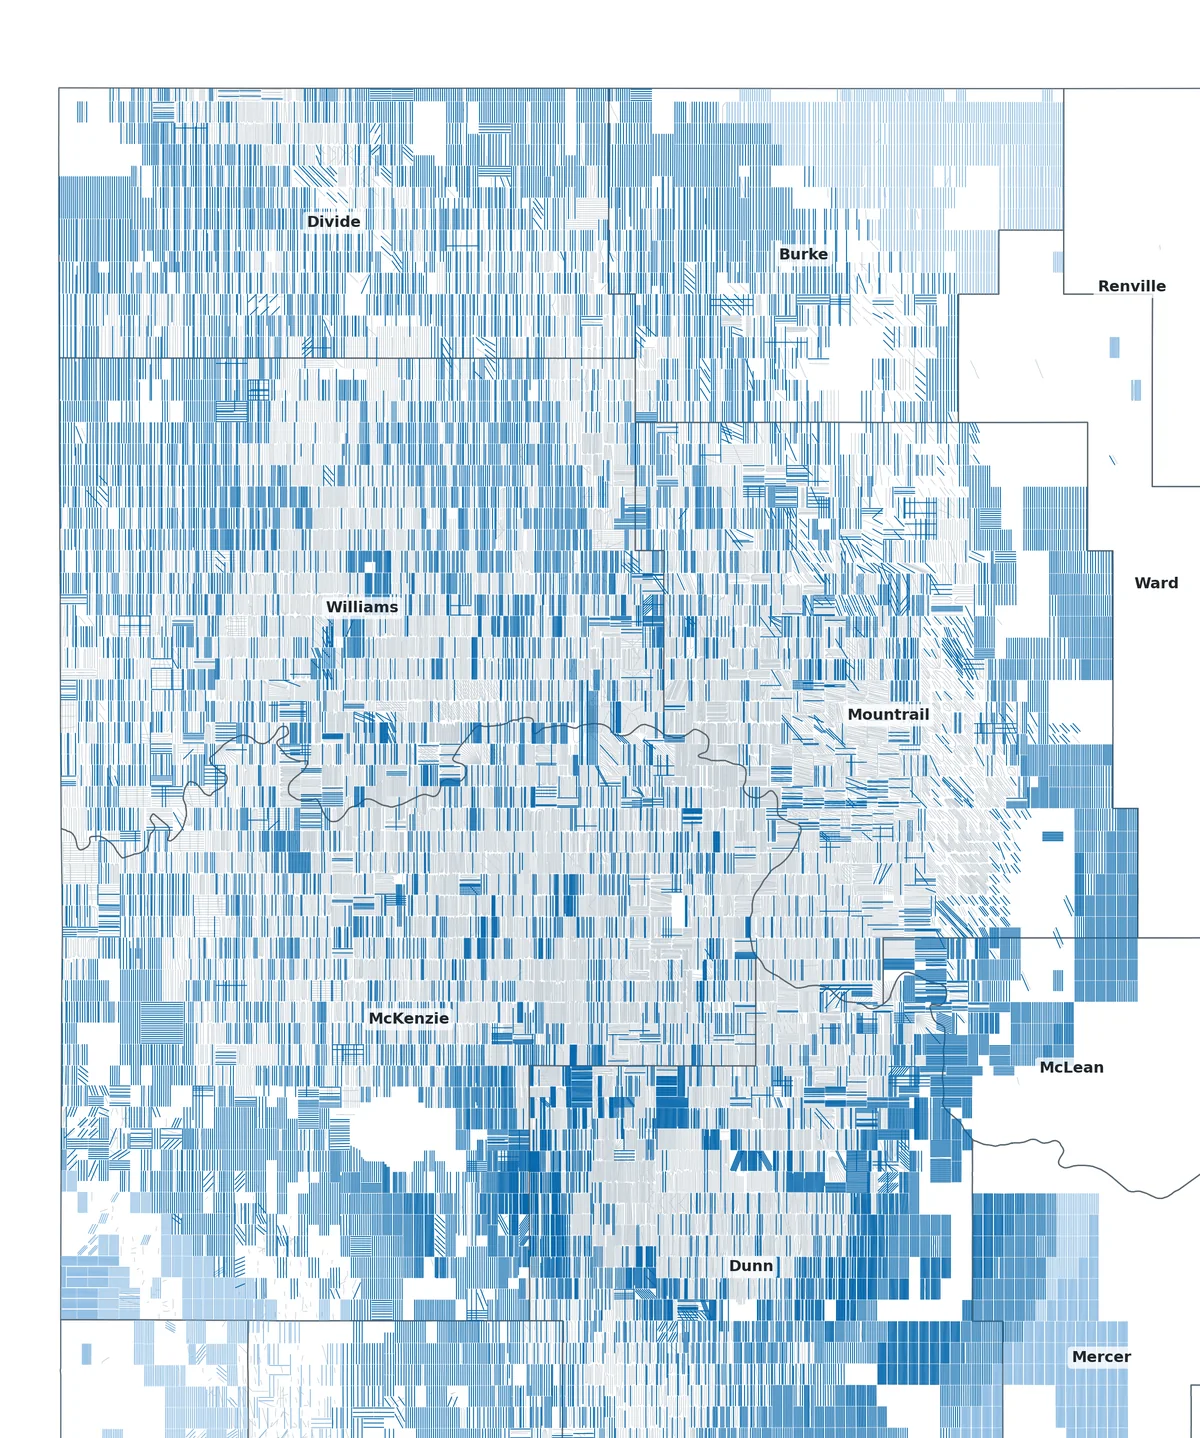
See where wells in the same operator group cluster around Williston. Open the map for the color legend.
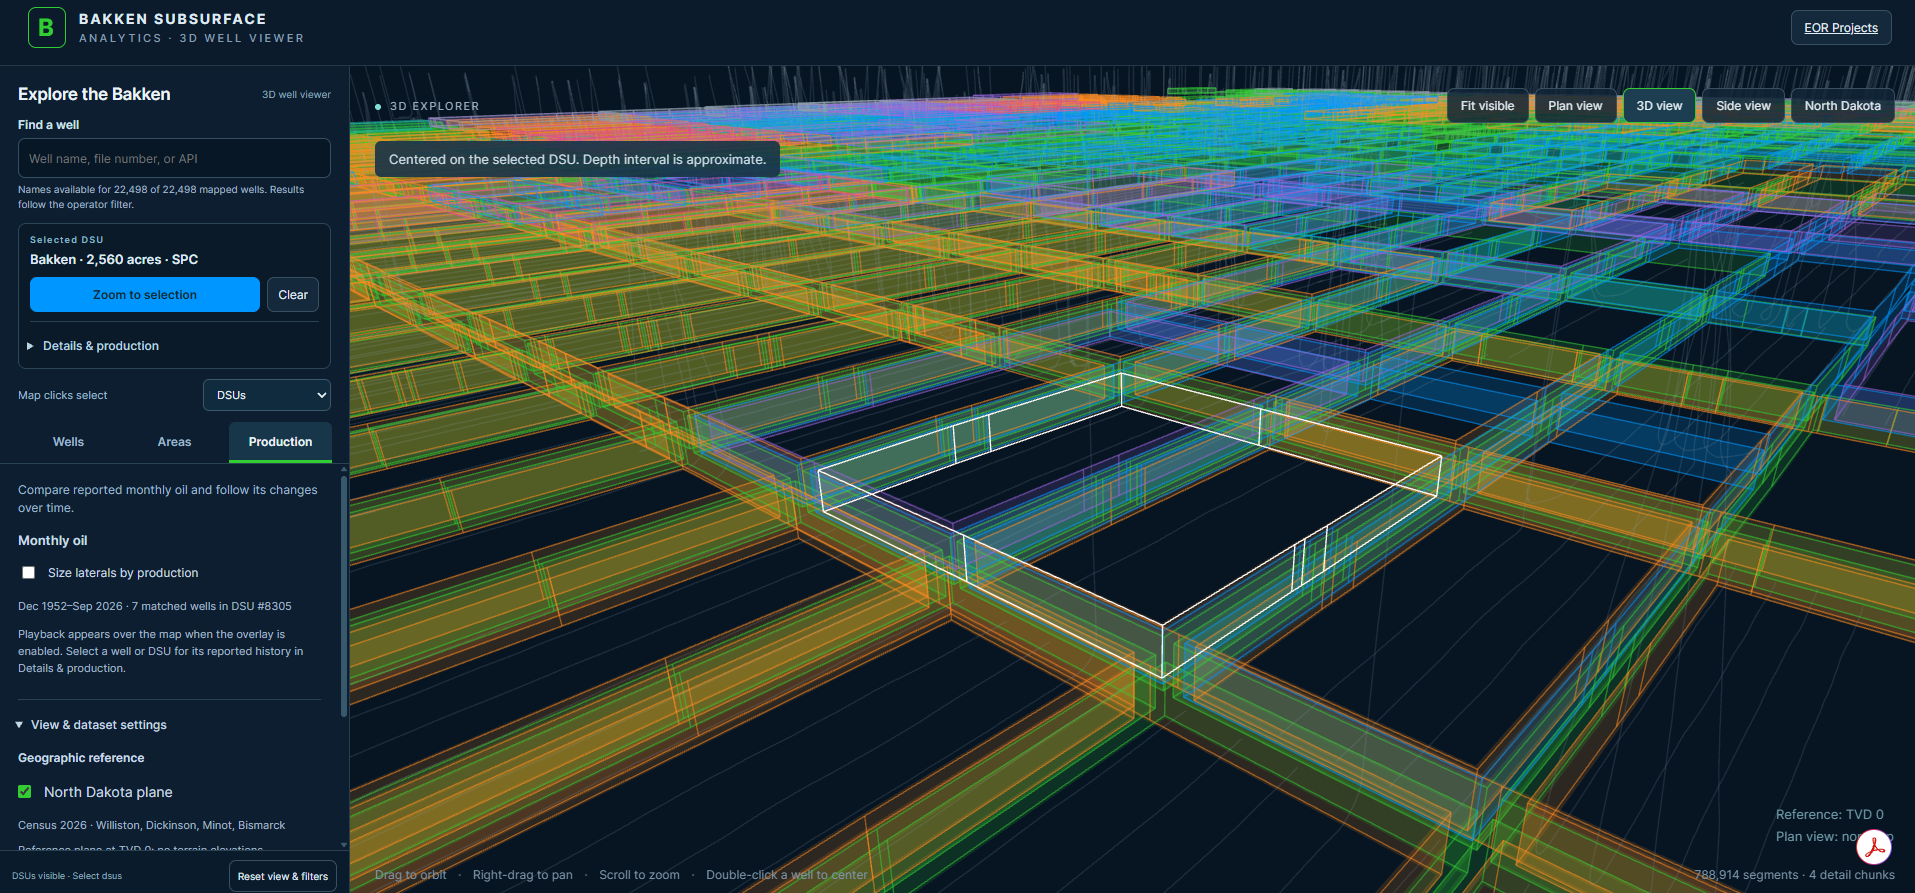
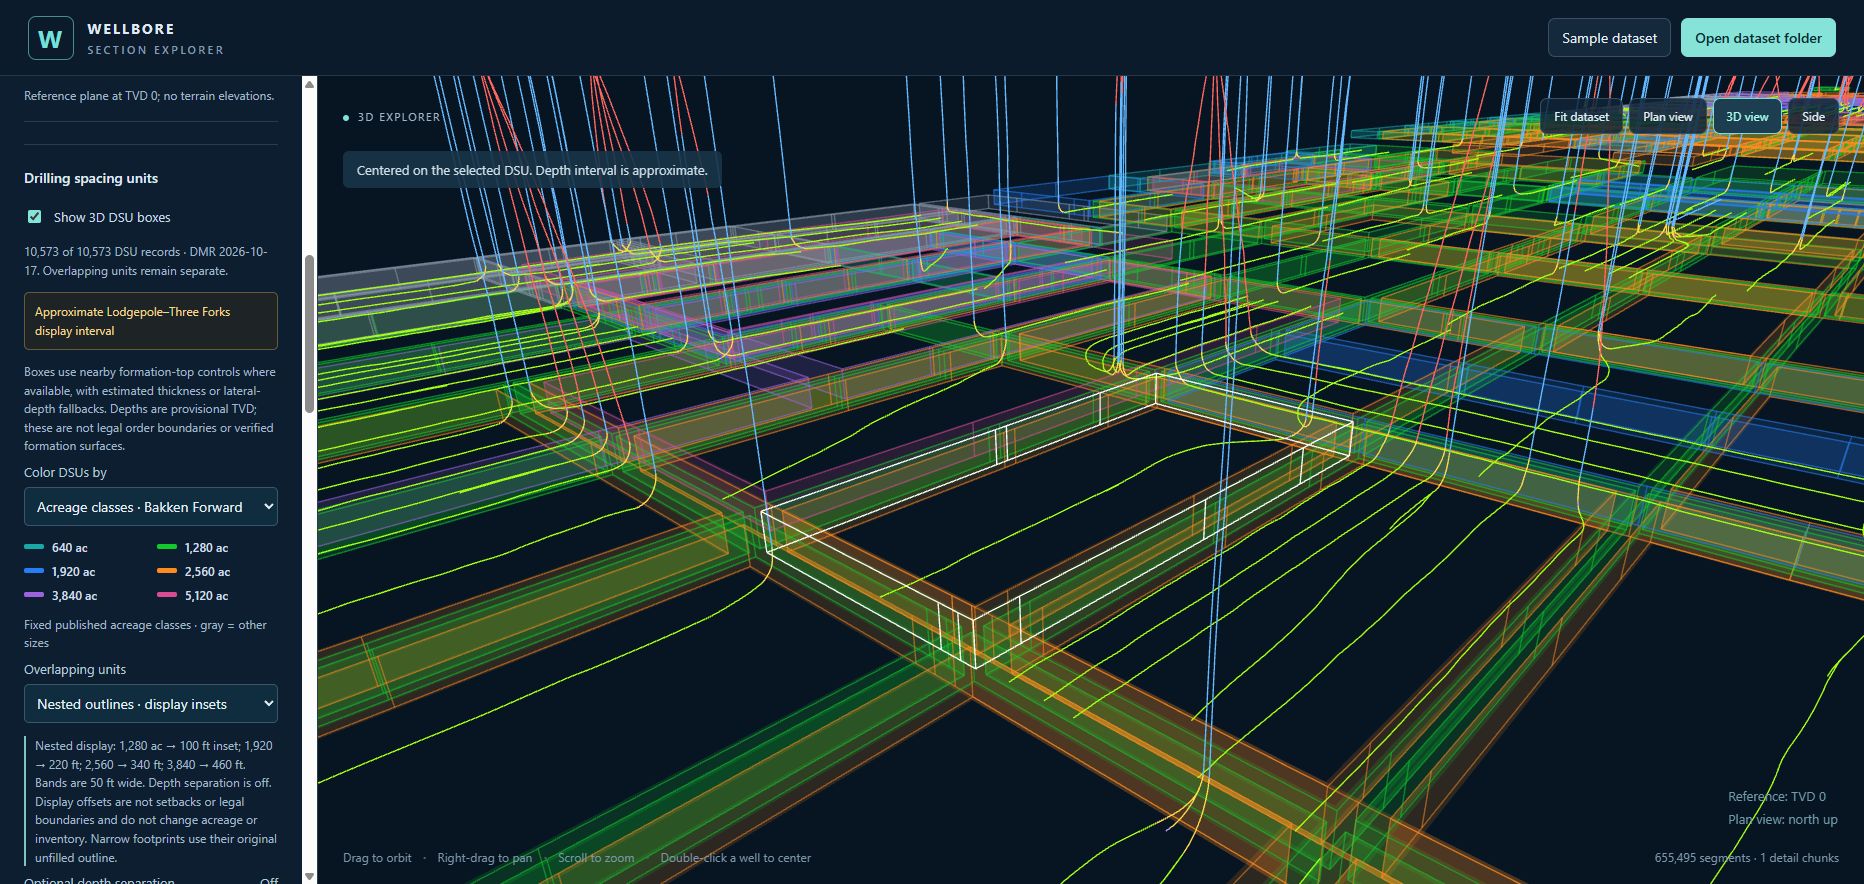
Follow the white outline of a 2,560-acre unit through its neighbors. The depth shown is approximate.
From the North Dakota hearing docket
Select a spacing unit to trace its order history. Compare the acreage covered by pooling orders and explore the subjects raised in 19,569 mapped hearing cases.
Explore the spacing-unit mapRoom to drill · November 2026
Every Bakken spacing unit, measured against the well density its own neighbourhood has already reached, with the laterals that still fit drawn into the gaps. A geometric count from public records, by county, township and operator, beside what the NDIC orders allow. No economics yet, and it says so.
Four guided perspectives
Start with a place and a question. These short, interactive tours bring the Bakken’s wellbore geometry into focus—from a heading reversal to a stacked development pilot.
Actual mapped paths · Cameras ready to explore
Owan
Trace the heading reversal, then use inclination colors to see the smaller changes along the turn.
Explore Owan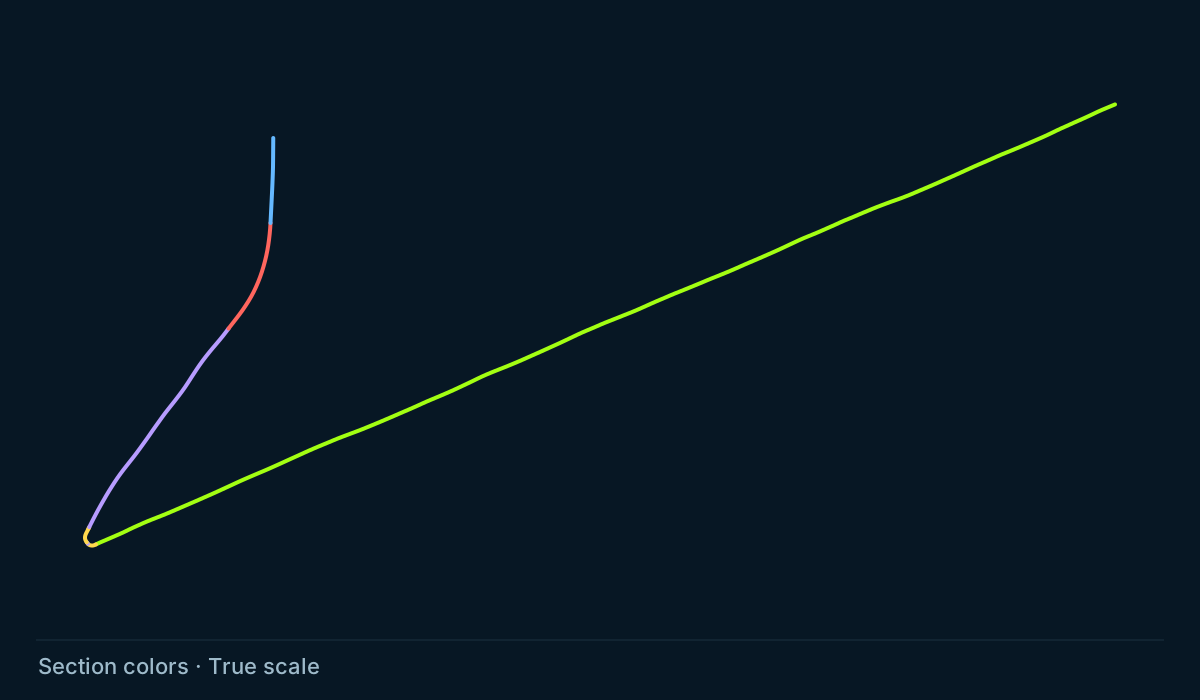
Nystuen
Compare depth with horizontal reach, then move closer to the lateral’s vertical profile.
Explore Nystuen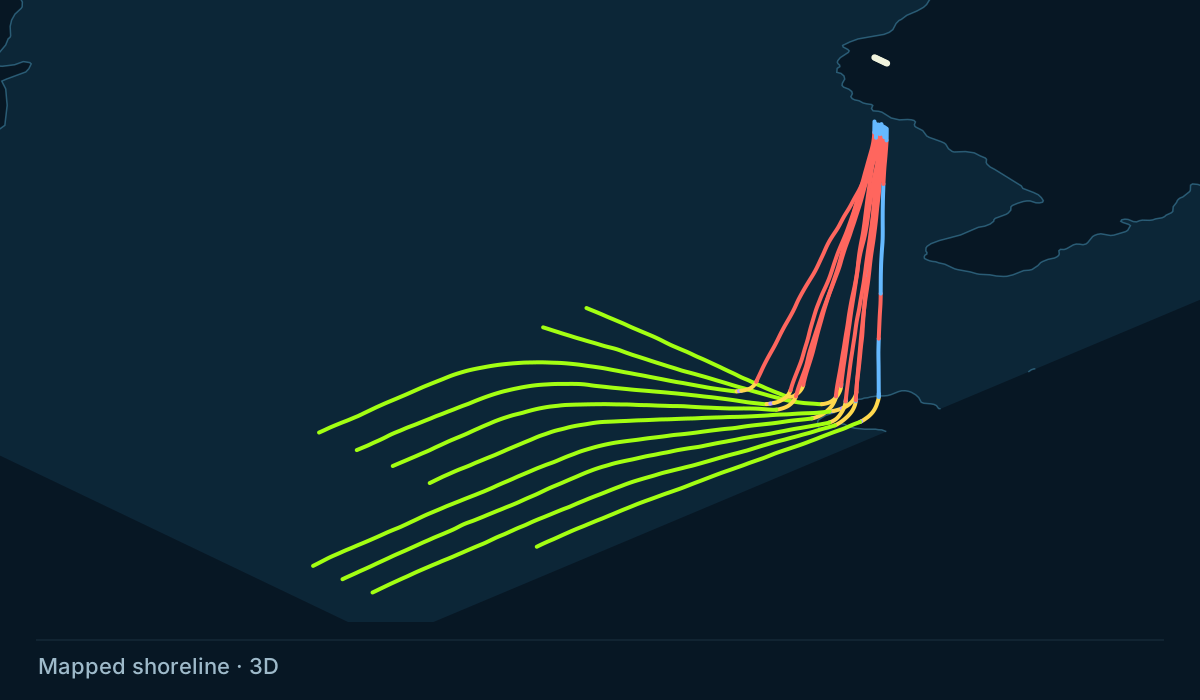
Torpedo
Follow ten mapped wells outward from a compact surface area beside Lake Sakakawea.
Explore Torpedo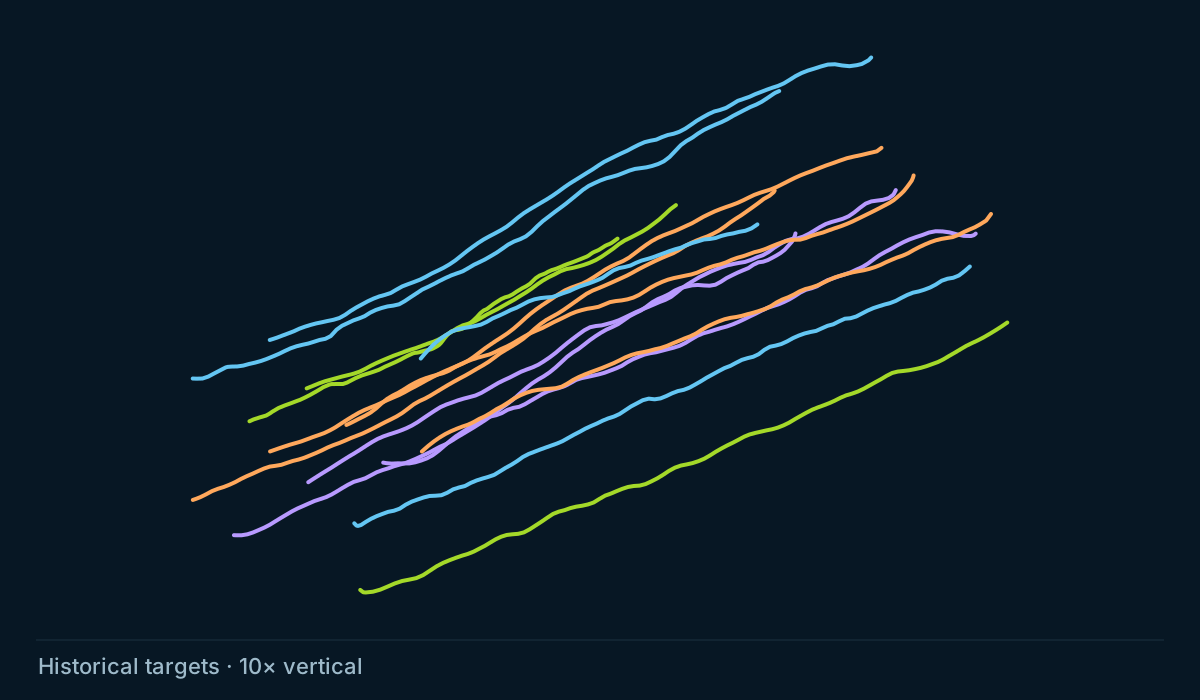
Hawkinson
Compare the surveyed paths with the published staggered design across Middle Bakken and Three Forks benches.
Explore HawkinsonSource notes and display assumptions travel with each tour. Historical design targets do not verify current completed intervals.
Explore the field
A well is more than a point on a surface map. Move around its full trajectory, follow changes along the path, and see how it fits into the surrounding field.
Open the interactive viewerNavigate classified well sections in 3D. Switch between azimuth, inclination, curvature, tortuosity, and dogleg severity (DLS) to explore variation along the mapped wellbore.
Mouse navigation · Section colors · Zoom to wellSearch North Dakota wells by name, file number or API. Each well’s page shows its operator, its spacing unit and its production as first reported in the free DMR monthly reports.
Well Index · October 28, 2026Start with North Dakota, zoom into a group of wells, and compare operator colors. Add drilling spacing units and township boundaries to understand the surrounding geography.
State boundary · Operators · DSUs · TownshipsCompare mapped lateral footage with adjustable capacity densities across DSUs and townships. See how the apparent development balance changes with each illustrative scenario.
Mapped footage · Adjustable density · Visible limitationsThe interpretation matters
A useful view should make its inputs and limits understandable. The methodology explains how geometry, production, and spatial measures become the layers you see.
Read the methodologySection classifications and engineering color views are derived from mapped paths. They are a way to explore the data, with resolution and source limitations.
Historical reported production adds a time dimension. A production display does not establish a completed interval or a well’s current status.
Footage capacity densities are illustrative, not calibrated forecasts. A footage balance is not a count of drillable locations, reserves, or a drilling schedule.
About me
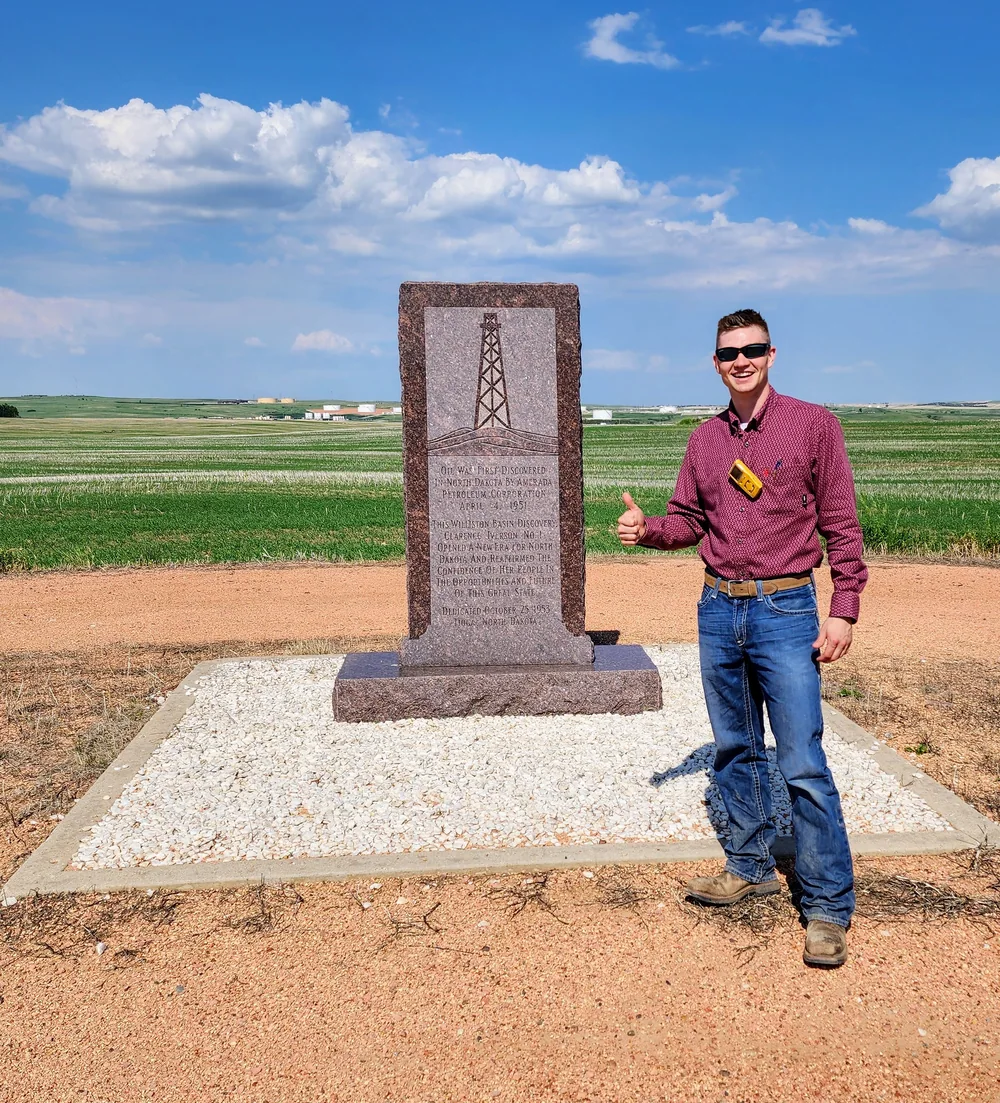
I’m Caleb Albertson. I was born and raised in western North Dakota and studied at the University of North Dakota. I’m a petroleum engineering professional with ten years in the Bakken oil and gas industry.
I’ve worked on frac jobs, drilling projects, and the regulatory side of the business. I’ve also worked on pipelines and the connections that bring new wells into production.
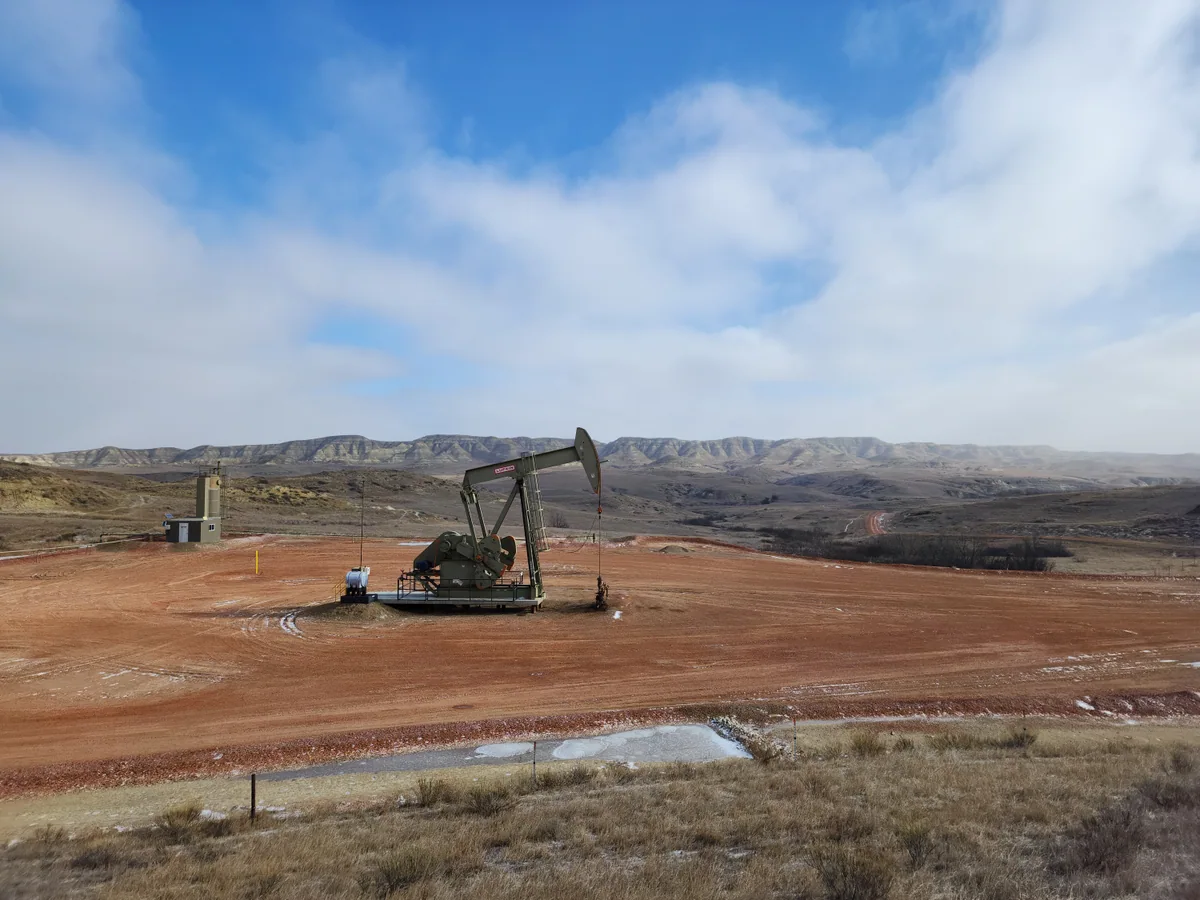
From the road, you can see a pumpjack. I built Bakken Subsurface Analytics so you can see where the well goes underground and how a spacing order on paper takes shape on the map.
Questions about a tract, a correction to the data, or a map or brief you would like made from the public record: send a note and I will reply.
Your next perspective