
North Dakota · Bakken spacing units · November 2026
Room to drill
How much infill drilling do the Bakken's spacing units still hold? This page counts the laterals that still fit in each of the 10,572 Bakken spacing units at the well density its own neighbourhood has already reached, draws them into the gaps between the existing wells, and adds them up by county, township and operator. It is a geometric count from public records: not a forecast, not a plan, and not yet an economic judgment.
Wells and surveys DMR GIS of October 17, 2026Orders signed through October 21, 2026Computed November 8, 2026
Headline numbers
Two-mile laterals make up 19,349 of the 21,805 candidates; 895 are three-mile and 551 four-mile pieces, and 1,010 are shorter than a mile and a half because the unit is. Overlapping spacing units are not additive: land is counted once, smallest unit first, so a unit that lies under a larger one shows only what the larger unit left. A further 4,364 laterals would fit the density but not the spacing rule and are counted, not drawn.
Where the room is
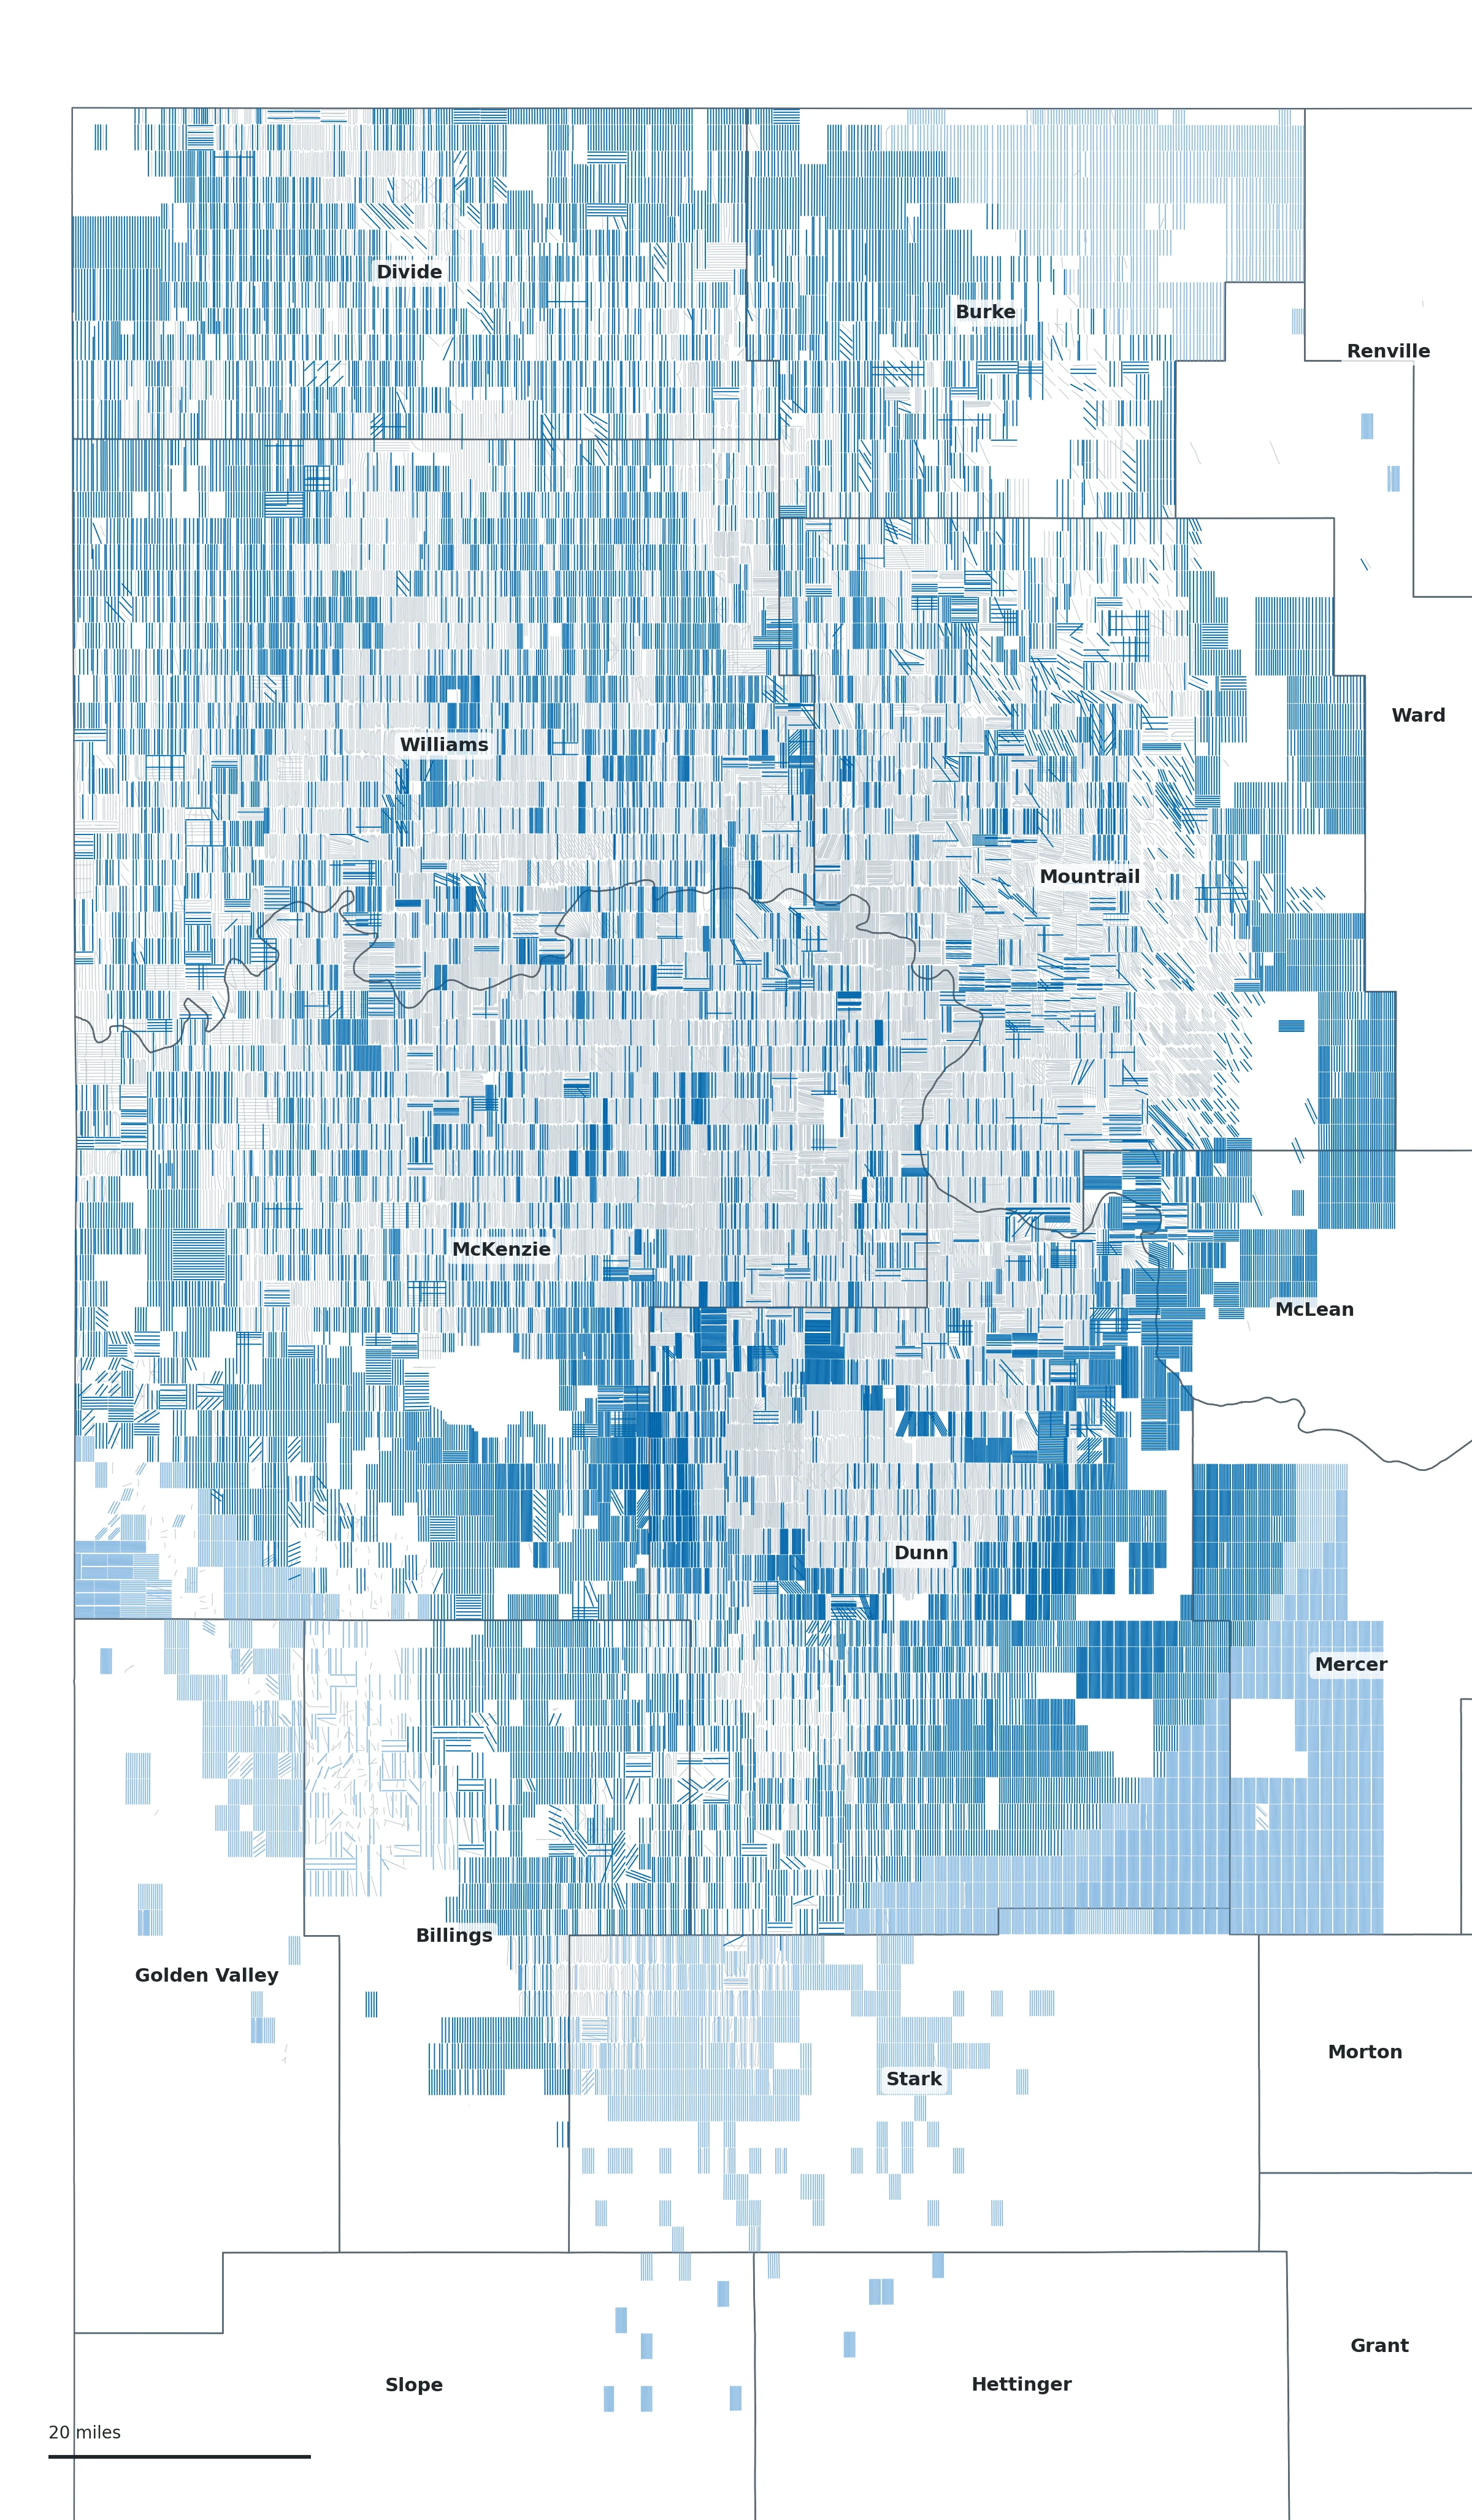
- Candidate lateral, target from a neighbourhood of developed units within 10 or 20 miles
- Candidate lateral, target from the county or basin value (no such neighbourhood)
- Existing surveyed lateral
- County line (U.S. Census TIGERweb)
Every candidate is a two-point line inside one NDIC spacing unit, placed along the direction of the laterals already there. Open the image for the full resolution, or see the same set in the 3D viewer under “Projected wells”; every spacing-unit page of the well index carries its own count.
How the count is made
- The units. Every drilling spacing unit in the DMR footprint layer whose reported formation is Bakken, with its acreage measured on the map (EPSG:5070): 10,572 units.
- What is already drilled. The surveyed laterals of Bakken-system wells (wells whose Well Index pools name a non-Bakken pool are left out; blank or confidential pools are kept as unknown), by the feet of lateral inside each unit; a well is present in a unit with at least 660 ft inside it. Footage is expressed in two-mile equivalents (10,560 ft = one).
- The local ceiling. Mature units (three or more wells and no spud for three years) show what a neighbourhood has actually drilled: its achieved density in two-mile equivalents per 1,280 acres. The target for a unit is the larger of the 75th percentile of the mature units within 10 miles and the median of the units with four or more wells that received a spud in the last three years, in the same neighbourhood. At least eight reference units must lie within 10 miles; otherwise 20 miles, otherwise the county, otherwise the basin as a whole. The county and basin stand-ins are flagged on the map and in every table.
- Room per unit. Target density × eligible acres / 1,280, less the two-mile equivalents already in the unit and less any candidate footage a smaller overlapping unit has already placed on the same land, divided by the unit's own lateral length and rounded to a whole lateral. Units are processed smallest first, so land is counted once.
- Placement. New laterals run in the direction of the laterals already in the unit (aligned to the unit's sides when within 20 degrees; the long axis of an empty elongated unit; the nearby laterals for an empty square one). They go into the widest gaps between the existing laterals so that the smallest spacing is as large as possible, and never closer to a neighbour than the larger of 330 ft and 0.6 of the unit's natural spacing at the target. Setbacks are 250 ft from the unit ends (existing laterals stop a median 233 ft from them) and 500 ft from the sides, 250 ft where units overlap. A lateral is at least 5,000 ft; pieces longer than four miles are split.
- Order headroom is read separately from the latest signed NDIC order linked to each unit: wells allowed, less the surveyed Bakken wells assigned exclusively to the unit, less pending permits by surface location. These facts are extracted from the orders' operative text by machine and are not human-reviewed.
Why the 75th percentile
The first version of this method used the neighbourhood median as the ceiling. Run as of October 2023 and checked against the three years of drilling that followed, that ceiling was exceeded by 61 percent of the units that were drilled. The target used here was chosen among eight candidates on that same hindcast, so the figures that follow are in-sample and flatter it somewhat. 18 percent of the drilled units ended above it, and the drilled units ended at a median 0.80 of it. It flagged 8,900 units as having room: 20.1 percent of those received a new lateral in the three years, against 5.9 percent of the units it did not flag, so a flagged unit was 3.4 times as likely to be drilled. As a ranking of which units get drilled it scores an AUC of 0.67, where 0.5 is no better than chance and 1.0 is perfect. Because it flags most units, nearly every new lateral fell in a flagged unit; that share reflects how many units are flagged more than how accurate the ceiling is. The chart in the next section shows the values by county.
Both numbers
This count comes from a November 2026 study of the same question. The study also classed each unit by an economic horizon (which of these laterals would pay at a $55, $65 or $75 oil price) and applied 1,019 expert adjustments to individual units; with that screen and those adjustments it counted 14,324 candidate laterals, and 15,774 with the screen alone. This page removes both and counts 21,805. Most of the difference is the units the screen left out: those with fewer than 15 analog wells within 20 miles, and those it classed above $75. The economic horizon is not published yet. It will be recomputed from the Division's free monthly production reports, the source behind the well index's production panels, and added here when it is.
Density ceiling · hindcast as of October 2023
Where the ceiling comes from
For the counties with at least 20 units drilled between October 2023 and October 2026: the neighbourhood median that the first method used as a ceiling, the target used here, both as they stood in October 2023, and the median density those drilled units had reached by October 2026. Two-mile equivalents per 1,280 acres.
The values as a table
| County | Units drilled Oct 2023 to Oct 2026 | Neighbourhood median, Oct 2023 | Target, Oct 2023 | Where they ended, Oct 2026 (median) |
|---|---|---|---|---|
| Dunn | 243 | 3.7 | 8.8 | 7.0 |
| McKenzie | 499 | 5.5 | 8.1 | 6.5 |
| Williams | 543 | 4.7 | 6.8 | 4.8 |
| Mountrail | 432 | 4.0 | 6.6 | 4.7 |
| Divide | 106 | 1.3 | 4.2 | 2.9 |
| Billings | 20 | 3.7 | 5.6 | 2.6 |
| Burke | 44 | 2.8 | 4.5 | 2.0 |
Source: density-ceilings.json. Divide County drilled to roughly twice its 2023 neighbourhood median, which is why a median ceiling under-counted there.
By county
Room to drill by county
Eligible Bakken spacing units, how many still have room, the candidate laterals (and how many of them rest on a county- or basin-wide density), the existing surveyed laterals, and the density the mature units in the county have reached. Counties are ordered by candidate count.
| County | Eligible units | Units with room | Candidate laterals | of which county/basin target | Two-mile eq. | 3- and 4-mile | Existing laterals | Mature units | Mature density, median | Mature density, middle half | Target density, median |
|---|---|---|---|---|---|---|---|---|---|---|---|
| Dunn | 1,582 | 945 | 4,672 | 1,057 | 4,534 | 173 | 3,707 | 738 | 6.9 | 3.7 to 9.3 | 9.1 |
| McKenzie | 2,371 | 1,115 | 3,817 | 454 | 3,788 | 312 | 6,579 | 1,202 | 7.8 | 5.7 to 9.7 | 8.8 |
| Williams | 2,047 | 971 | 2,934 | 0 | 2,882 | 157 | 4,161 | 941 | 5.5 | 3.6 to 7.5 | 6.3 |
| Mountrail | 1,932 | 809 | 2,197 | 0 | 2,093 | 148 | 4,270 | 1,036 | 6.9 | 4.5 to 8.7 | 7.7 |
| Divide | 898 | 561 | 1,764 | 0 | 1,797 | 293 | 936 | 195 | 3.6 | 2.3 to 4.6 | 4.7 |
| Mercer | 202 | 201 | 1,666 | 1,332 | 1,583 | 0 | 3 | 0 | — | — | 8.6 |
| Burke | 645 | 450 | 1,580 | 693 | 1,651 | 264 | 336 | 73 | 2.2 | 1.0 to 4.6 | 3.8 |
| Billings | 423 | 337 | 1,122 | 148 | 1,068 | 35 | 333 | 56 | 2.8 | 1.6 to 3.5 | 4.2 |
| Stark | 238 | 199 | 985 | 983 | 946 | 0 | 232 | 76 | 2.9 | 2.8 to 4.7 | 5.6 |
| McLean | 130 | 100 | 514 | 0 | 528 | 64 | 52 | 29 | 3.5 | 2.7 to 5.3 | 6.9 |
| Golden Valley | 84 | 75 | 423 | 423 | 395 | 0 | 35 | 0 | — | — | 5.6 |
| Slope | 8 | 8 | 65 | 65 | 62 | 0 | 2 | 0 | — | — | 8.6 |
| Hettinger | 5 | 5 | 42 | 42 | 40 | 0 | 0 | 0 | — | — | 8.6 |
| Ward | 6 | 4 | 24 | 23 | 22 | 0 | 7 | 0 | — | — | 5.0 |
| Renville | 1 | 0 | 0 | 0 | 0 | 0 | 3 | 0 | — | — | 8.6 |
Mercer, Stark, Golden Valley, Slope and Hettinger have few or no mature Bakken units, so their targets are the county or basin value and their candidates are a geometric statement about unit size, not evidence that the rock supports that density. Density figures are two-mile equivalents per 1,280 eligible acres. Full table: by-county.json.
By township
The forty townships with the most room
Candidate laterals by PLSS township (township north, range west). Every township with an eligible unit is in by-township.json (440 townships); each township also has a page on the well index.
| Township | County | Eligible units | Units with room | Candidate laterals | Two-mile eq. |
|---|---|---|---|---|---|
| T141N R91W | Dunn | 18 | 18 | 180 | 172 |
| T142N R91W | Dunn | 18 | 18 | 180 | 171 |
| T141N R89W | Mercer | 18 | 18 | 162 | 154 |
| T141N R90W | Mercer | 18 | 18 | 162 | 154 |
| T142N R89W | Mercer | 18 | 18 | 162 | 154 |
| T143N R89W | Mercer | 18 | 18 | 161 | 153 |
| T144N R89W | Mercer | 18 | 18 | 160 | 152 |
| T144N R92W | Dunn | 18 | 18 | 159 | 151 |
| T142N R90W | Mercer | 19 | 19 | 156 | 147 |
| T144N R90W | Mercer | 18 | 18 | 156 | 148 |
| T141N R92W | Dunn | 18 | 18 | 152 | 145 |
| T143N R91W | Dunn | 18 | 18 | 147 | 140 |
| T141N R93W | Dunn | 18 | 18 | 144 | 137 |
| T146N R90W | Mercer | 18 | 18 | 143 | 136 |
| T145N R89W | Mercer | 18 | 18 | 142 | 135 |
| T141N R94W | Dunn | 18 | 18 | 139 | 132 |
| T146N R92W | Dunn | 20 | 18 | 136 | 129 |
| T147N R98W | McKenzie | 31 | 20 | 130 | 126 |
| T145N R90W | Mercer | 18 | 18 | 129 | 123 |
| T145N R92W | Dunn | 15 | 15 | 127 | 121 |
| T144N R91W | Dunn | 18 | 18 | 126 | 120 |
| T142N R92W | Dunn | 18 | 18 | 124 | 118 |
| T143N R93W | Dunn | 18 | 18 | 124 | 122 |
| T150N R88W | McLean | 18 | 18 | 124 | 118 |
| T151N R88W | Mountrail | 18 | 18 | 122 | 116 |
| T149N R89W | McLean | 18 | 18 | 121 | 115 |
| T147N R92W | Dunn | 38 | 28 | 118 | 111 |
| T146N R89W | Mercer | 18 | 18 | 115 | 110 |
| T145N R93W | Dunn | 26 | 17 | 113 | 108 |
| T146N R97W | Dunn | 30 | 18 | 111 | 105 |
| T141N R95W | Dunn | 18 | 18 | 110 | 105 |
| T146N R98W | McKenzie | 18 | 16 | 110 | 110 |
| T147N R97W | Dunn | 33 | 25 | 110 | 105 |
| T152N R88W | Mountrail | 18 | 18 | 107 | 104 |
| T139N R95W | Stark | 18 | 18 | 106 | 101 |
| T145N R104W | McKenzie | 18 | 13 | 104 | 99 |
| T148N R98W | McKenzie | 26 | 17 | 104 | 99 |
| T153N R88W | Mountrail | 18 | 18 | 103 | 98 |
| T145N R96W | Dunn | 34 | 19 | 102 | 95 |
| T146N R100W | McKenzie | 19 | 18 | 102 | 97 |
NDIC orders · signed through October 21, 2026
Order headroom by county
A different measure of room: what the Commission's orders allow. For every unit with a single stated well allowance in its latest linked order, the wells allowed, the surveyed Bakken wells assigned exclusively to the unit, the pending permits by surface location, and the headroom that remains. Headroom is regulatory room, not a drillable location; a unit can be over its allowance where orders have since changed or wells are shared.
| County | Units with an allowance | Wells allowed | Assigned | Pending permits | Headroom (positive) | After pending | Units with room for 2+ | Units over their allowance |
|---|---|---|---|---|---|---|---|---|
| McKenzie | 1,778 | 10,638 | 5,758 | 328 | 5,293 | 5,102 | 922 | 131 |
| Williams | 1,485 | 8,115 | 3,877 | 328 | 4,484 | 4,338 | 823 | 84 |
| Mountrail | 1,455 | 7,223 | 4,013 | 194 | 3,315 | 3,232 | 786 | 59 |
| Dunn | 1,043 | 6,139 | 3,172 | 249 | 3,239 | 3,123 | 638 | 88 |
| Divide | 720 | 3,176 | 865 | 205 | 2,370 | 2,259 | 391 | 23 |
| Burke | 356 | 1,648 | 278 | 96 | 1,371 | 1,300 | 211 | 1 |
| Billings | 330 | 1,270 | 268 | 52 | 1,009 | 983 | 232 | 3 |
| Stark | 169 | 527 | 225 | 6 | 305 | 299 | 84 | 3 |
| McLean | 40 | 236 | 45 | 10 | 192 | 192 | 20 | 1 |
| Golden Valley | 65 | 185 | 18 | 9 | 167 | 161 | 40 | 0 |
| Mercer | 1 | 1 | 1 | 0 | 0 | 0 | 0 | 0 |
| All counties | 7,442 | 39,158 | 18,520 | 1,477 | 21,745 | 20,989 | 4,147 | 393 |
Allowances are facts extracted from the operative text of signed orders by the project's order pipeline, machine-extracted and not human-reviewed; the same figures appear on each spacing-unit page. Data: headroom-by-county.json.
By operator
Where the room sits, by operator
A spacing unit is attributed to an operator when every surveyed well present in it reports that operator, or an entity grouped under it (the grouping follows public acquisition records and is listed below). Units with wells of more than one operator are mixed; units with no surveyed well are unassigned, which means no well, not no owner: lease ownership is in no public layer used here. The table lists operators alphabetically with at least 30 candidate laterals or 150 wells of order headroom; every operator is in by-operator.json. These are public-record facts about where room remains, not a ranking and not a statement of anyone's plans.
| Operator | Units attributed | Candidate laterals | Two-mile eq. | 3- and 4-mile | Units with an allowance | Wells allowed | Assigned | Pending | Headroom (positive) | After pending | Units with room for 2+ |
|---|---|---|---|---|---|---|---|---|---|---|---|
| Chesapeake Operating Inc. | 6 | 33 | 31 | 0 | 1 | 1 | 1 | 0 | 0 | 0 | 0 |
| Chevron Corporation (6 reported names) | 554 | 887 | 844 | 25 | 558 | 2,990 | 1,964 | 117 | 1,134 | 1,105 | 255 |
| Chord Energy Corporation (5 reported names) | 1,634 | 2,231 | 2,140 | 60 | 1,709 | 10,129 | 4,752 | 259 | 5,445 | 5,314 | 1,015 |
| ConocoPhillips (5 reported names) | 426 | 854 | 811 | 8 | 545 | 2,949 | 1,844 | 104 | 1,347 | 1,300 | 237 |
| Continental Resources Inc. | 738 | 1,188 | 1,145 | 54 | 709 | 4,328 | 2,158 | 97 | 2,657 | 2,623 | 370 |
| Cornerstone Natural Resources LLC | 29 | 50 | 43 | 1 | 52 | 184 | 16 | 12 | 168 | 159 | 25 |
| Devon Energy Corporation (4 reported names) | 549 | 637 | 621 | 33 | 543 | 3,155 | 1,952 | 141 | 1,234 | 1,181 | 255 |
| EOG Resources Inc. (3 reported names) | 468 | 243 | 212 | 30 | 468 | 2,052 | 737 | 31 | 1,335 | 1,320 | 290 |
| ExxonMobil (2 reported names) | 259 | 611 | 578 | 30 | 276 | 1,643 | 906 | 126 | 782 | 711 | 159 |
| Formentera Operations LLC | 153 | 282 | 263 | 26 | 133 | 644 | 233 | 36 | 438 | 416 | 83 |
| Foundation Energy Management LLC | 70 | 145 | 130 | 0 | 85 | 307 | 67 | 24 | 240 | 223 | 74 |
| Hunt Oil Company | 195 | 319 | 306 | 17 | 207 | 605 | 252 | 55 | 361 | 342 | 77 |
| Koda Resources Operating LLC | 67 | 87 | 104 | 36 | 71 | 277 | 68 | 97 | 209 | 141 | 45 |
| Kraken Operating LLC (2 reported names) | 392 | 477 | 452 | 21 | 349 | 1,916 | 997 | 67 | 929 | 899 | 193 |
| Lime Rock Resources (3 reported names) | 186 | 258 | 241 | 7 | 192 | 1,203 | 403 | 17 | 811 | 798 | 146 |
| Murex Petroleum Corporation | 74 | 219 | 214 | 9 | 80 | 467 | 144 | 25 | 323 | 304 | 61 |
| Murfin Drilling Company Inc. | 13 | 39 | 38 | 0 | 14 | 72 | 13 | 0 | 59 | 59 | 12 |
| NP Resources LLC | — | 0 | 0 | 0 | 41 | 158 | 1 | 0 | 157 | 157 | 40 |
| Petro-Hunt group (3 reported names) | 418 | 669 | 632 | 25 | 383 | 1,545 | 696 | 39 | 864 | 846 | 205 |
| Phoenix Operating LLC | 47 | 35 | 43 | 16 | 143 | 731 | 127 | 109 | 607 | 526 | 119 |
| Prima Exploration Inc. | 22 | 68 | 67 | 2 | 26 | 115 | 28 | 4 | 88 | 88 | 18 |
| Rockport Energy Solutions LLC | 7 | 41 | 38 | 4 | 6 | 34 | 10 | 0 | 24 | 24 | 4 |
| Silver Hill Energy Operating LLC | 80 | 128 | 142 | 50 | 75 | 473 | 170 | 32 | 326 | 297 | 58 |
| Slawson Exploration Company Inc. | 182 | 138 | 129 | 7 | 230 | 1,004 | 559 | 17 | 449 | 435 | 122 |
| SOGC LLC | 27 | 126 | 122 | 5 | 30 | 170 | 89 | 7 | 83 | 81 | 18 |
| TXO Partners LP | 100 | 308 | 289 | 0 | 87 | 463 | 111 | 0 | 352 | 352 | 68 |
| Valkyrie Operating LLC | 17 | 49 | 47 | 0 | 11 | 84 | 11 | 0 | 73 | 73 | 11 |
| White Rock Oil Gas LLC | 43 | 37 | 28 | 0 | 20 | 62 | 15 | 3 | 47 | 44 | 9 |
| Unassigned units (no surveyed well present) | 1,831 | 10,068 | 10,133 | 861 | — | — | — | — | — | — | — |
| Mixed units (more than one operator present) | 1,896 | 1,403 | 1,382 | 111 | — | — | — | — | — | — | — |
Which reported operator names each row groups
Reported operator names from the DMR wells layer of October 17, 2026, grouped where a public acquisition or an alias is on record (the number of wells under each name in brackets).
- Chevron Corporation
- HESS BAKKEN INVESTMENTS II, LLC (2,909 wells); AMERADA HESS CORPORATION (723 wells); CHEVRON USA, INC. (95 wells); HESS CORPORATION (91 wells); HESS WATER SERVICES LLC (13 wells); HESS TIOGA GAS PLANT LLC (2 wells)
- Chord Energy Corporation
- WHITING OIL AND GAS CORPORATION (2,535 wells); OASIS PETROLEUM NORTH AMERICA LLC (2,222 wells); ENERPLUS RESOURCES USA CORPORATION (1,357 wells); QEP ENERGY COMPANY (99 wells); WHITING PETROLEUM CORPORATION (12 wells)
- ConocoPhillips
- BURLINGTON RESOURCES OIL & GAS COMPANY LP (1,432 wells); MARATHON OIL COMPANY (1,328 wells); CONOCO INC. (129 wells); BURLINGTON RESOURCES OIL & GAS COMPANY (97 wells); PHILLIPS PETROLEUM COMPANY (27 wells)
- Devon Energy Corporation
- DEVON ENERGY WILLISTON, L.L.C. (2,355 wells); STATOIL OIL & GAS LP (57 wells); RIM OPERATING, INC. (54 wells); DEVON ENERGY PRODUCTION COMPANY, L.P. (3 wells)
- EOG Resources Inc.
- EOG RESOURCES, INC. (1,291 wells); EOG (NEW MEXICO) INC. (25 wells); EOG (OKLAHOMA) INC. (3 wells)
- ExxonMobil
- XTO ENERGY INC (1,406 wells); DENBURY ONSHORE, LLC (479 wells)
- Kraken Operating LLC
- KRAKEN OPERATING, LLC (981 wells); Zavanna Energy Operating, LLC (288 wells)
- Lime Rock Resources
- LIME ROCK RESOURCES III-A, L.P. (398 wells); LIME ROCK RESOURCES V-A, L.P. (83 wells); ABRAXAS PETROLEUM CORP. (45 wells)
- Petro-Hunt group
- PETRO-HUNT, L.L.C. (1,065 wells); PETRO-HUNT DAKOTA, LLC (179 wells); PETRO-HUNT CORP. (5 wells)
The longer-lateral trend
Laterals are getting longer
The room counted above assumes laterals the length of the unit. Operators are increasingly drilling three- and four-mile laterals, and the Commission is forming units shaped for them, which changes how the remaining land gets used: a three-mile lateral needs the next section along the azimuth, so two-mile units with open or same-operator acreage at their ends are the ones most likely to be redrawn.
The values as a table, and how the study counted
| Year | 3- and 4-mile laterals spudded | All surveyed wells spudded | Share | 3-mile-plus units, first linked order |
|---|---|---|---|---|
| 2015 | 66 | 1,327 | 5% | 9 |
| 2016 | 22 | 586 | 4% | 11 |
| 2017 | 31 | 1,023 | 3% | 22 |
| 2018 | 75 | 1,274 | 6% | 20 |
| 2019 | 52 | 1,241 | 4% | 15 |
| 2020 | 26 | 491 | 5% | 19 |
| 2021 | 31 | 547 | 6% | 34 |
| 2022 | 81 | 863 | 9% | 56 |
| 2023 | 198 | 859 | 23% | 90 |
| 2024 | 280 | 912 | 31% | 123 |
| 2025 | 338 | 690 | 49% | 175 |
| 2026* | 122 | 155 | 79% | 255 |
* 2026 is partial: wells to October 17, orders to October 21. A long lateral has at least 13,200 ft of surveyed lateral (the midpoint between nominal two- and three-mile lengths); a long unit has a footprint three or four sections long. The underlying study counted long laterals by their first production year, which comes from a production source this site does not publish; this page counts them by spud year from the free wells layer. Both series, where they overlap:
| Year | By spud year (this page) | By first production year (study) |
|---|---|---|
| 2019 | 52 | 63 |
| 2020 | 26 | 24 |
| 2021 | 31 | 36 |
| 2022 | 81 | 53 |
| 2023 | 198 | 159 |
| 2024 | 280 | 258 |
| 2025 | 338 | 266 |
| 2026 | 122 | 163 |
Data: long-laterals.json.
What this count is not
- Not permits, orders, leases, plans or a forecast. A candidate is a line that fits a geometric rule. Whether anyone can or will drill it depends on rights, orders, benches, interference, prices and operating constraints that are not in the public layers used here.
- No economics yet. The study behind this page screened units by the price at which nearby wells pay back; that screen is held back until it has been recomputed from the free monthly production reports. Until then every eligible unit is projected, including fringe units whose nearby wells may not support the density.
- Unknown targets. Middle Bakken and Three Forks wells plot on top of one another in plan view, and no public layer says which bench a lateral is in. A candidate is never placed over an existing lateral, so stacked development is under-counted where it happens.
- County and basin stand-ins. Where fewer than eight developed units lie within 20 miles, the county or basin density is used. 5,220 candidates in 1,015 units rest on that stand-in; they are flagged everywhere and drawn lighter.
- Overlapping units are not additive. Land is counted once, so the count in a unit depends on the smaller units that overlap it. Per-unit figures on the well index say so.
- Machine-read orders. Allowances, assigned wells and pending permits come from the order pipeline's reading of signed orders and the DMR layers; they are not human-reviewed and a stated allowance is what that order allowed, not proof that it governs today.
- Survey coverage. Only surveyed horizontal wells count as drilled footage. A well without a survey, a vertical well or a well whose survey ends short of its lateral is not seen, so some room is already taken.
- A snapshot. Wells and surveys as of October 17, 2026; orders through October 21, 2026. The count will be refreshed with the site's data releases and re-tested against the drilling that follows.
Data and sources
Everything on this page is in these files, generated by the same run (JSON; the candidate set as GeoJSON lines in WGS84):
- candidates.geojson: every candidate lateral with its unit, county, township, operator, length, class and target density (21,805 features)
- by-county.json, by-township.json, by-operator.json, headroom-by-county.json
- density-ceilings.json, long-laterals.json, summary.json (the headline counts and both numbers)
Sources: North Dakota Industrial Commission, Department of Mineral Resources, Oil and Gas Division: the public GIS downloads of October 17, 2026 (horizontal surveys, wells layer, drilling spacing units), the Well Index of October 28, 2026 (pools), and signed hearing orders through October 21, 2026 as read by this project's order pipeline. County lines: U.S. Census Bureau TIGERweb. The Division notes that its GIS information may be inaccurate or out of date and does not warrant it. No production data, no subscription content and no order document is used or redistributed here. The method is described on the methodology page; the same candidate set is drawn in the 3D viewer and counted on every spacing-unit page of the well index.