
Montana · Bakken and Three Forks
The Bakken in Montana
The Bakken runs west across the state line into Richland and Roosevelt counties. This page follows Montana's side from the state's own free public records: where the horizontal wells are, what they produce each month, and who operates them.
Production through August 2026 State files retrieved November 18, 2026 Page built November 18, 2026
One formation, two states
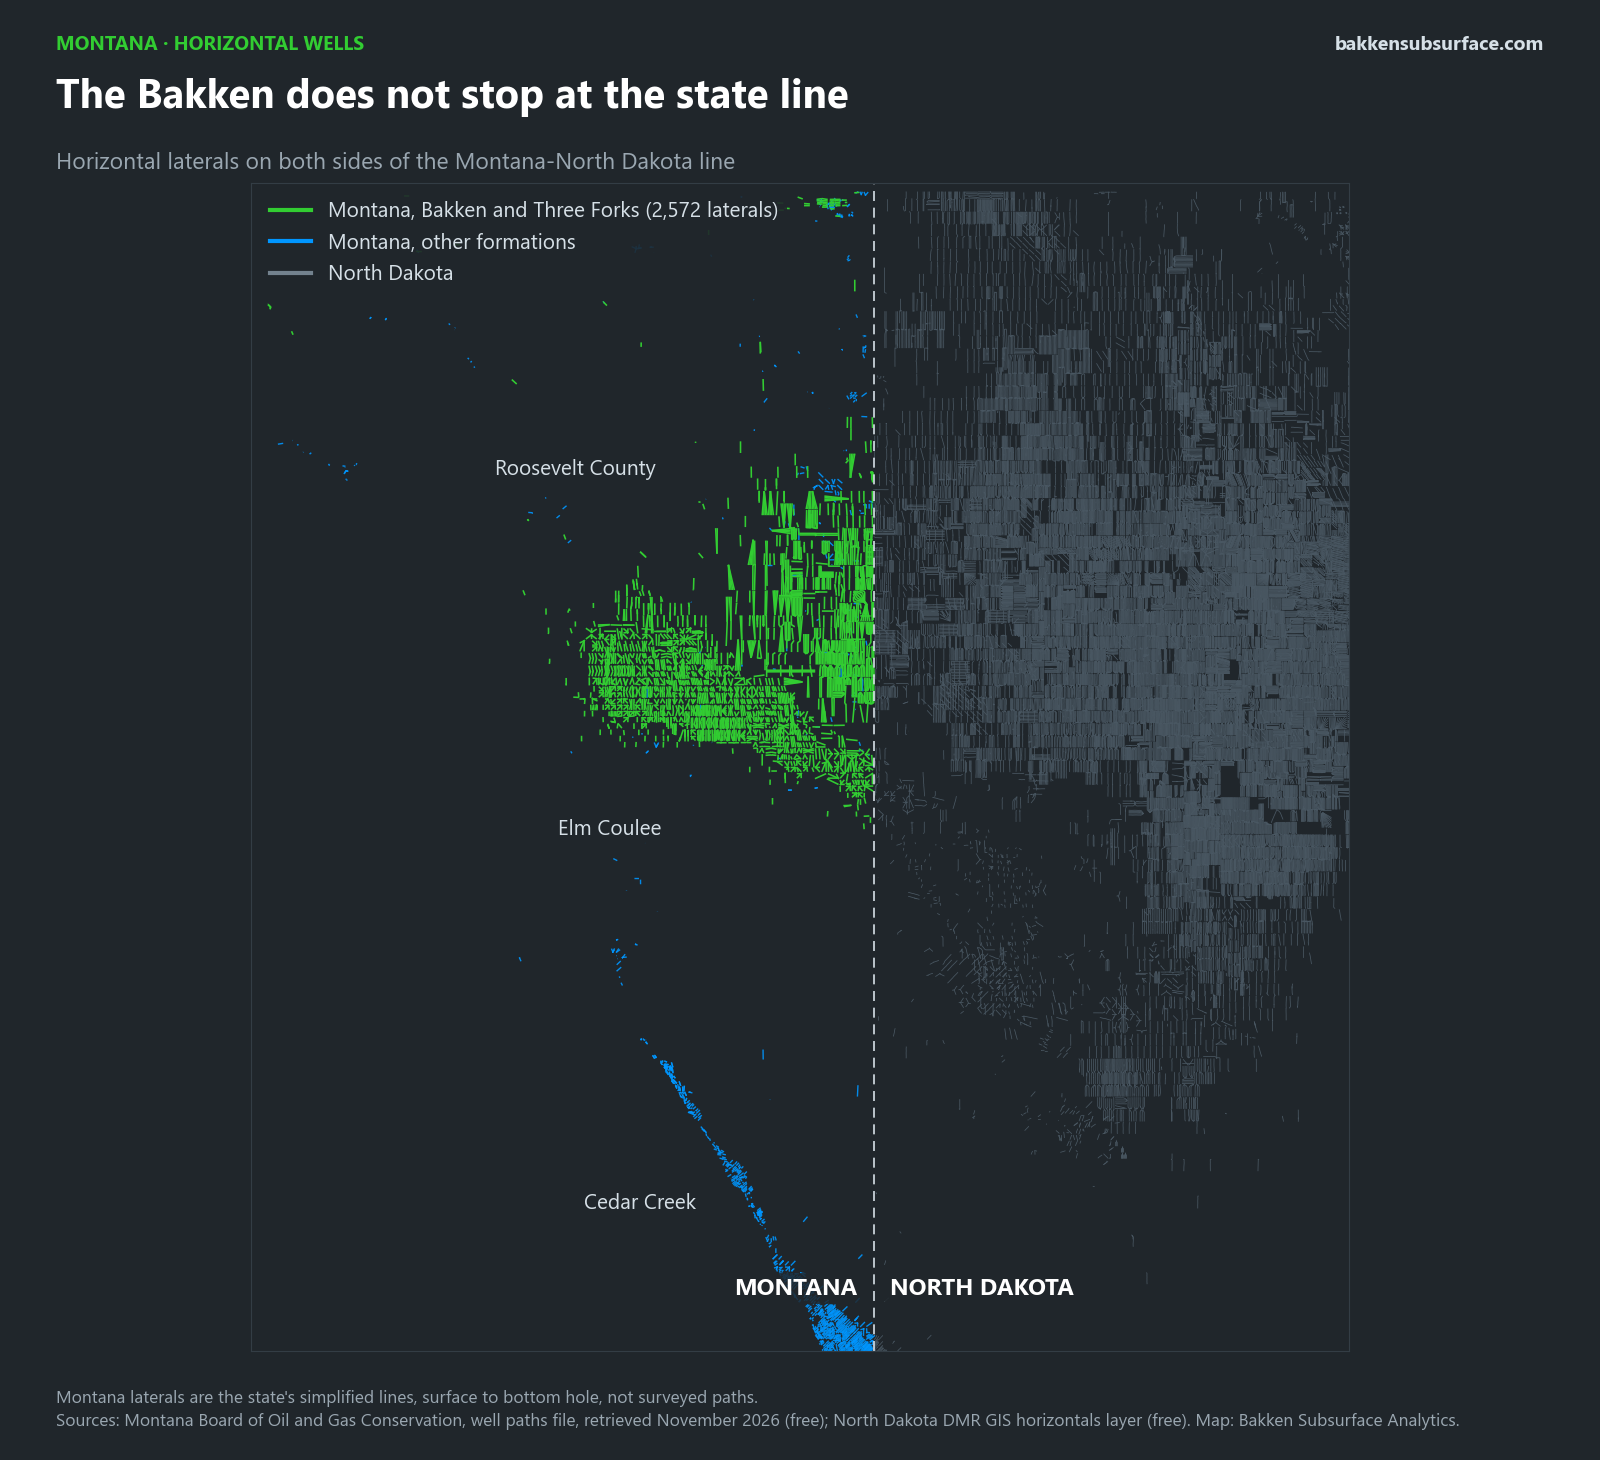
Montana has 2,572 Bakken and Three Forks laterals on 1,687 wells, most of them in the Elm Coulee field of Richland County and, more recently, in Roosevelt County to the north. They meet North Dakota's wells at the state line.
A record, two decades after Elm Coulee
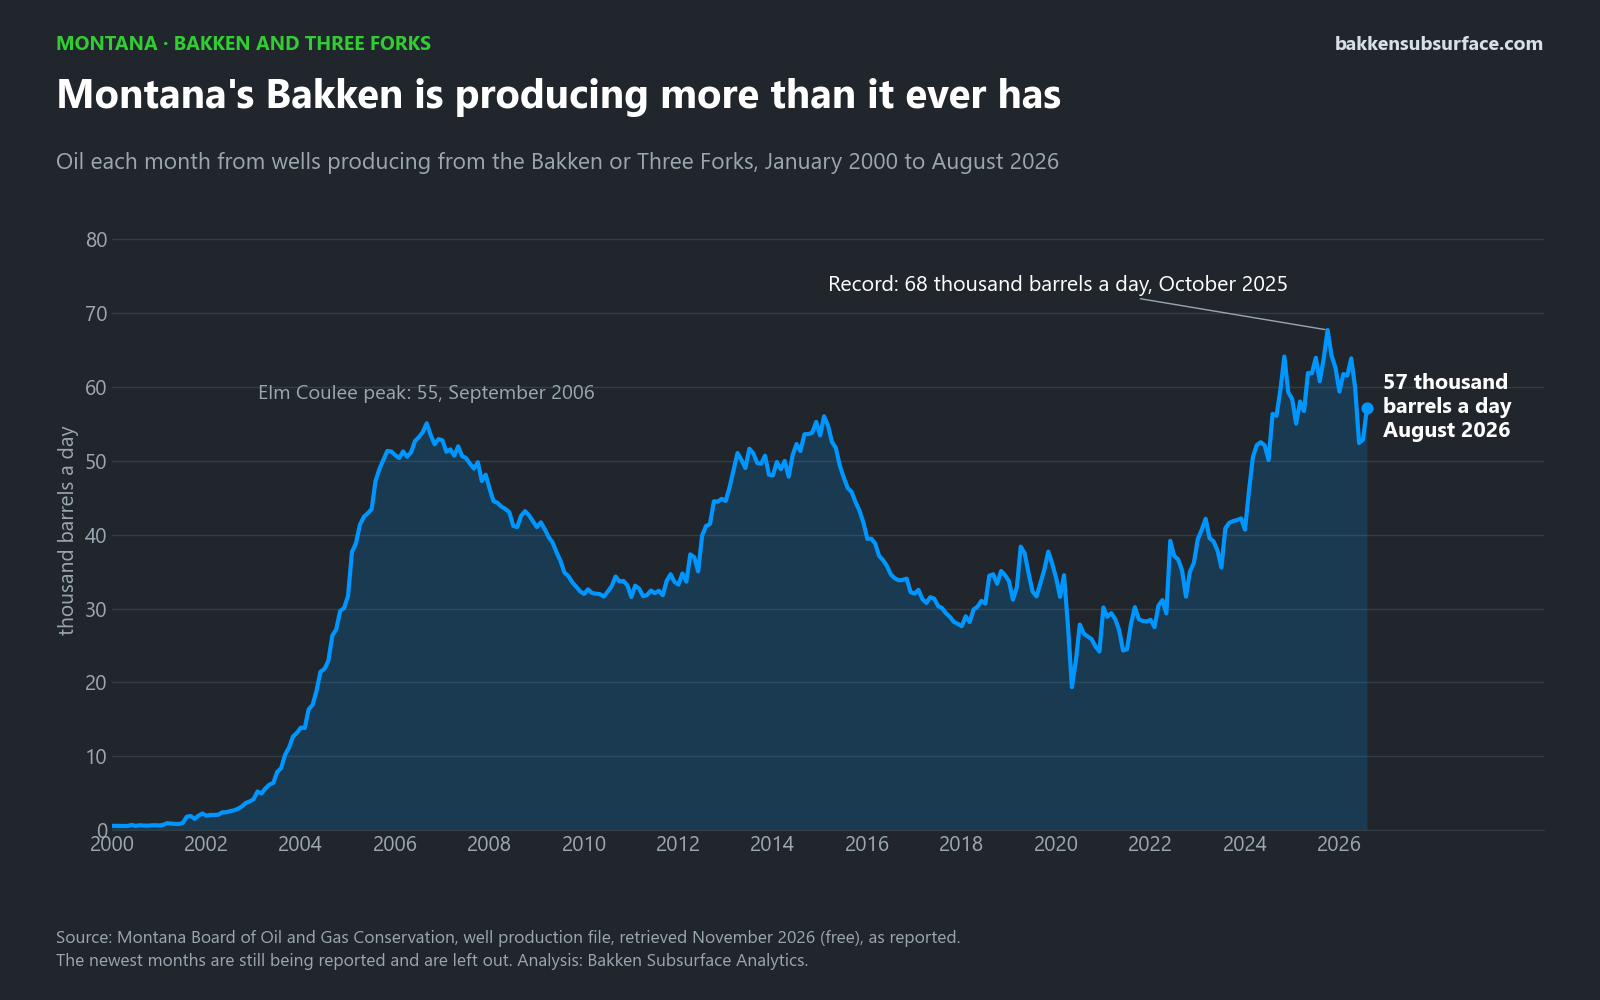
Elm Coulee made Montana's Bakken famous, peaking at 55,086 barrels a day in September 2006. A second rise followed in 2012 to 2015. The third has gone higher than either: 67,722 barrels a day in October 2025. In August 2026, the latest full month, 1,261 wells produced 57,188 barrels a day.
Fewer new wells than either boom
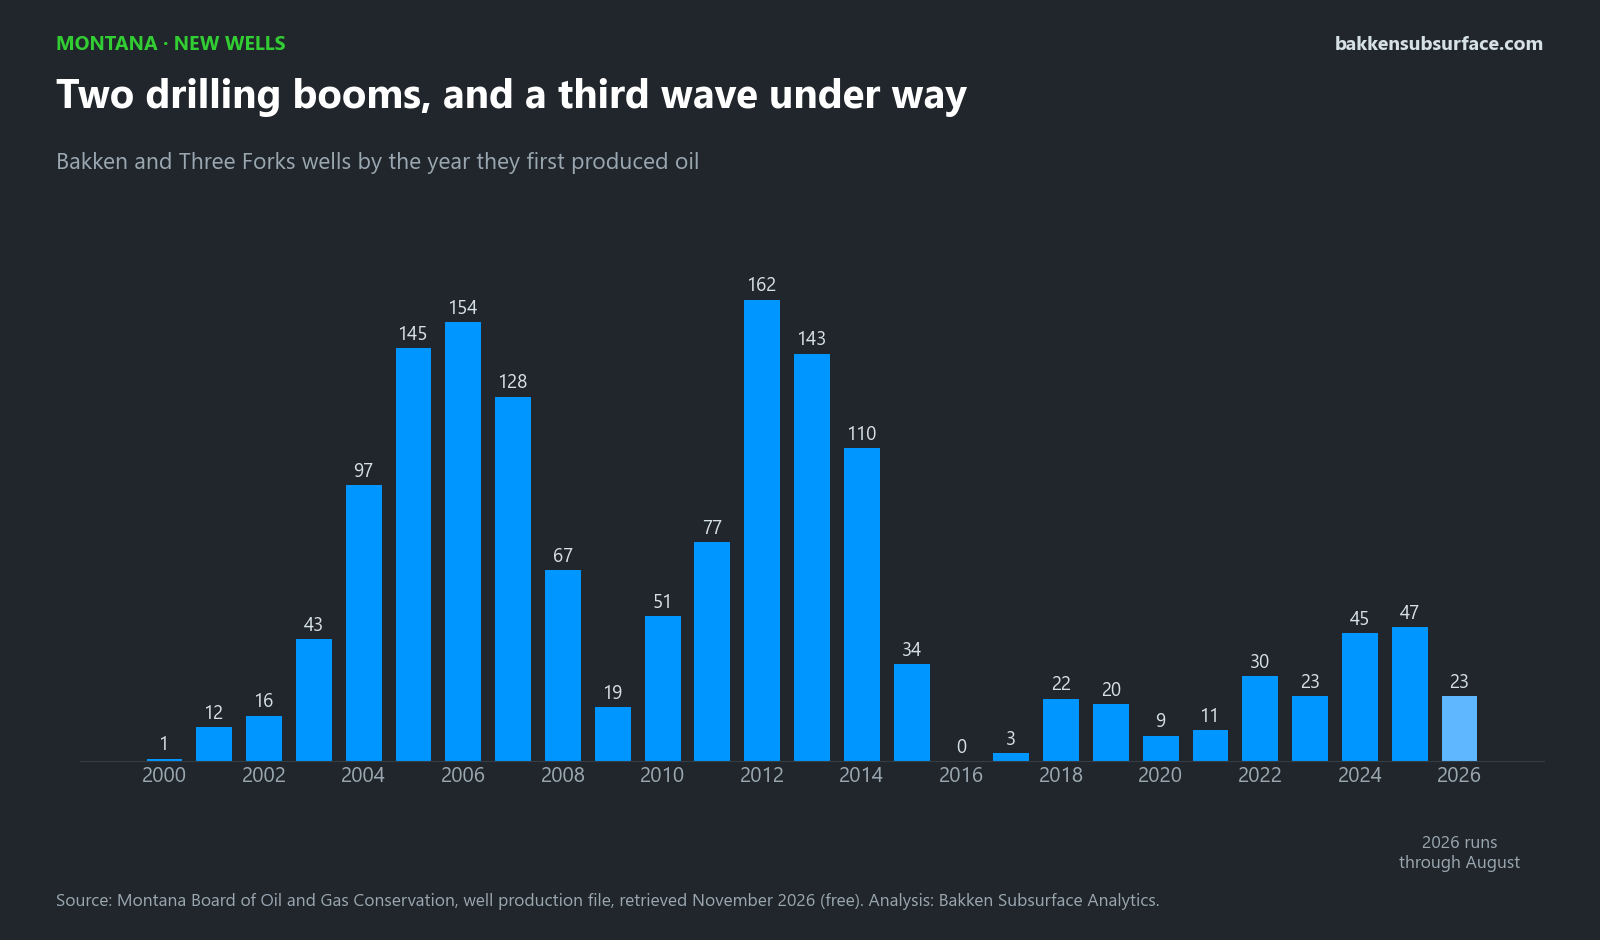
The record is coming from far fewer wells than the booms of 2004 to 2007 and 2011 to 2014. In 2025, 47 wells produced their first oil.
Gas and water
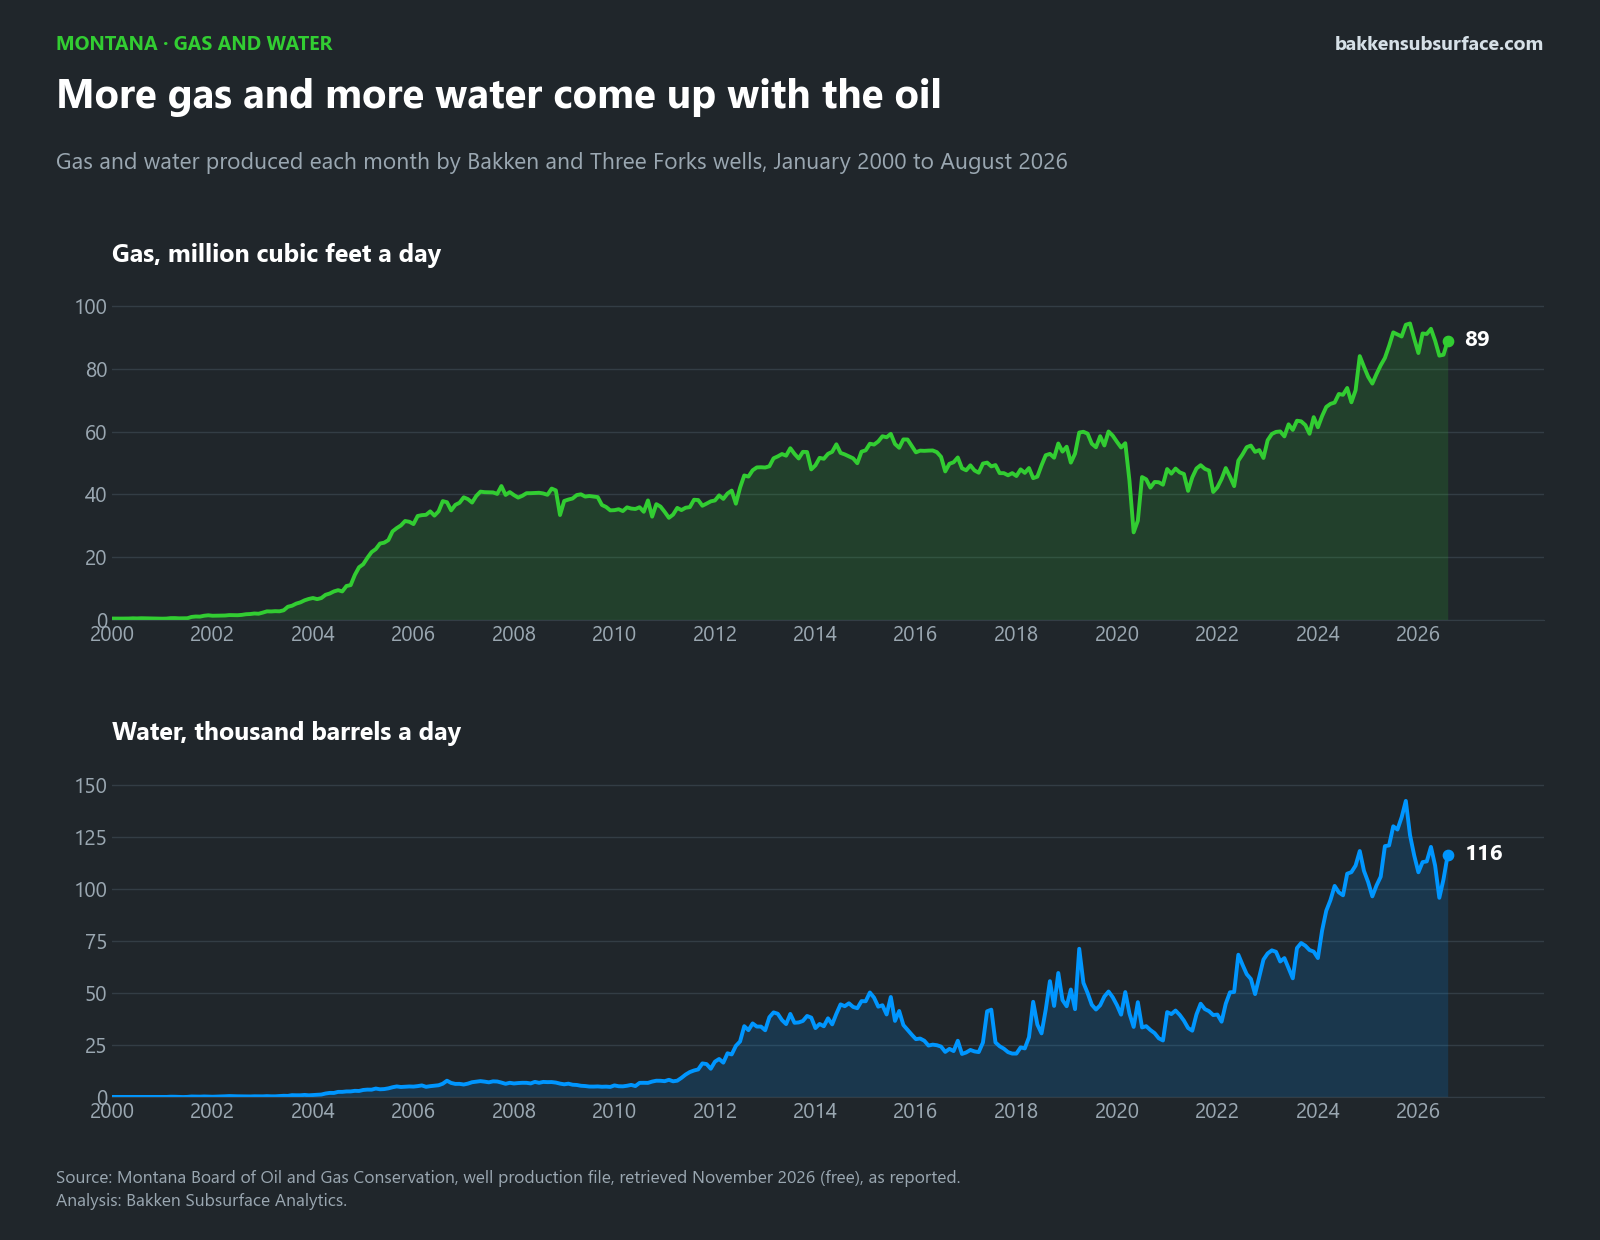
The same wells produced 88,885 thousand cubic feet of gas and 116,427 barrels of water a day in August 2026. Over the last twelve months they made about 1.9 barrels of water for each barrel of oil.
Where the oil comes from
Bakken and Three Forks wells by county in August 2026.
| County | Wells with oil | Barrels a day | Share |
|---|---|---|---|
| Glacier | 1 | 1 | 0% |
| Richland | 1,044 | 39,692 | 69% |
| Roosevelt | 196 | 17,348 | 30% |
| Sheridan | 19 | 145 | 0% |
| Toole | 1 | 1 | 0% |
Glacier and Toole counties are in north-western Montana, where a few wells produce from a separate Bakken play.
Who operates the wells
Operators of record with Bakken or Three Forks oil in August 2026, in alphabetical order. These are counts and totals from the state's production file for one month; they are not a judgement of compliance or of any company.
| Operator of record | Wells with oil | Barrels a day |
|---|---|---|
| Armstrong Operating, Inc. | 1 | 15 |
| Continental Resources Inc | 268 | 4,499 |
| Devon Energy Williston, L.L.C. | 25 | 9,063 |
| Foundation Energy Management, LLC | 1 | 1 |
| Granite Creek Energy LLC | 1 | 6 |
| Green Valley Operating, LLC | 5 | 43 |
| Kraken Operating, LLC | 211 | 23,393 |
| MorningStar Operating LLC | 386 | 9,568 |
| Murex Petroleum Corp. | 1 | 2 |
| Northern Oil Production, Inc. | 2 | 11 |
| Oasis Petroleum North America LLC | 89 | 1,788 |
| Petro-Hunt, LLC | 15 | 156 |
| Phoenix Operating LLC | 8 | 1,305 |
| Prima Exploration, Inc. | 21 | 1,343 |
| Ridge Oil & Gas, LLC | 4 | 25 |
| Rosetta Resources Operating LP | 1 | 1 |
| Slawson Exploration Company Inc | 20 | 297 |
| SOGC, Inc. | 5 | 32 |
| Somont Oil Company, Inc. | 1 | 1 |
| SpringLine Operating LLC | 1 | 0 |
| Swanson Oil & Gas LLC | 16 | 75 |
| True Oil LLC | 4 | 244 |
| Wesco Operating, Inc. | 4 | 19 |
| White Rock Oil & Gas, LLC | 92 | 4,085 |
| Whiting Oil and Gas Corporation | 69 | 1,124 |
| WY Basin Operating LLC | 10 | 90 |
About this page
Source
Everything here comes from the Montana Board of Oil and Gas Conservation public files: the well list, the well-by-well production file and the well paths file, retrieved November 18, 2026. They are free, with no login. The state lists 42,051 wells in all; this page covers those that have produced from the Bakken or Three Forks.
Method
- A well counts as Bakken or Three Forks when the state's production record names either formation, including a few wells reported with a second formation.
- Barrels a day is the month's reported volume divided by the days in the month.
- The state's file fills in over several weeks. The page stops at the latest month with nearly all of its wells reported.
Limits
- The laterals are simplified. The state publishes a line from the surface location to the bottom hole, not the surveyed path, so they show where a well goes, not its exact course or depth.
- Values are as reported; operators can amend past months.
- This is not an official record of the State of Montana. Nothing here is a forecast, an estimate of reserves, or advice about any well, lease or company.
What comes next
Montana's Bakken and Three Forks wells are in the viewer beside North Dakota's, drawn from the state's simplified lines. The other pages of this site still cover North Dakota only.