Follow every turn.
Navigate classified well sections in 3D. Switch between azimuth, inclination, curvature, tortuosity, and dogleg severity (DLS) to explore variation along the mapped wellbore.
Mouse navigation · Section colors · Zoom to well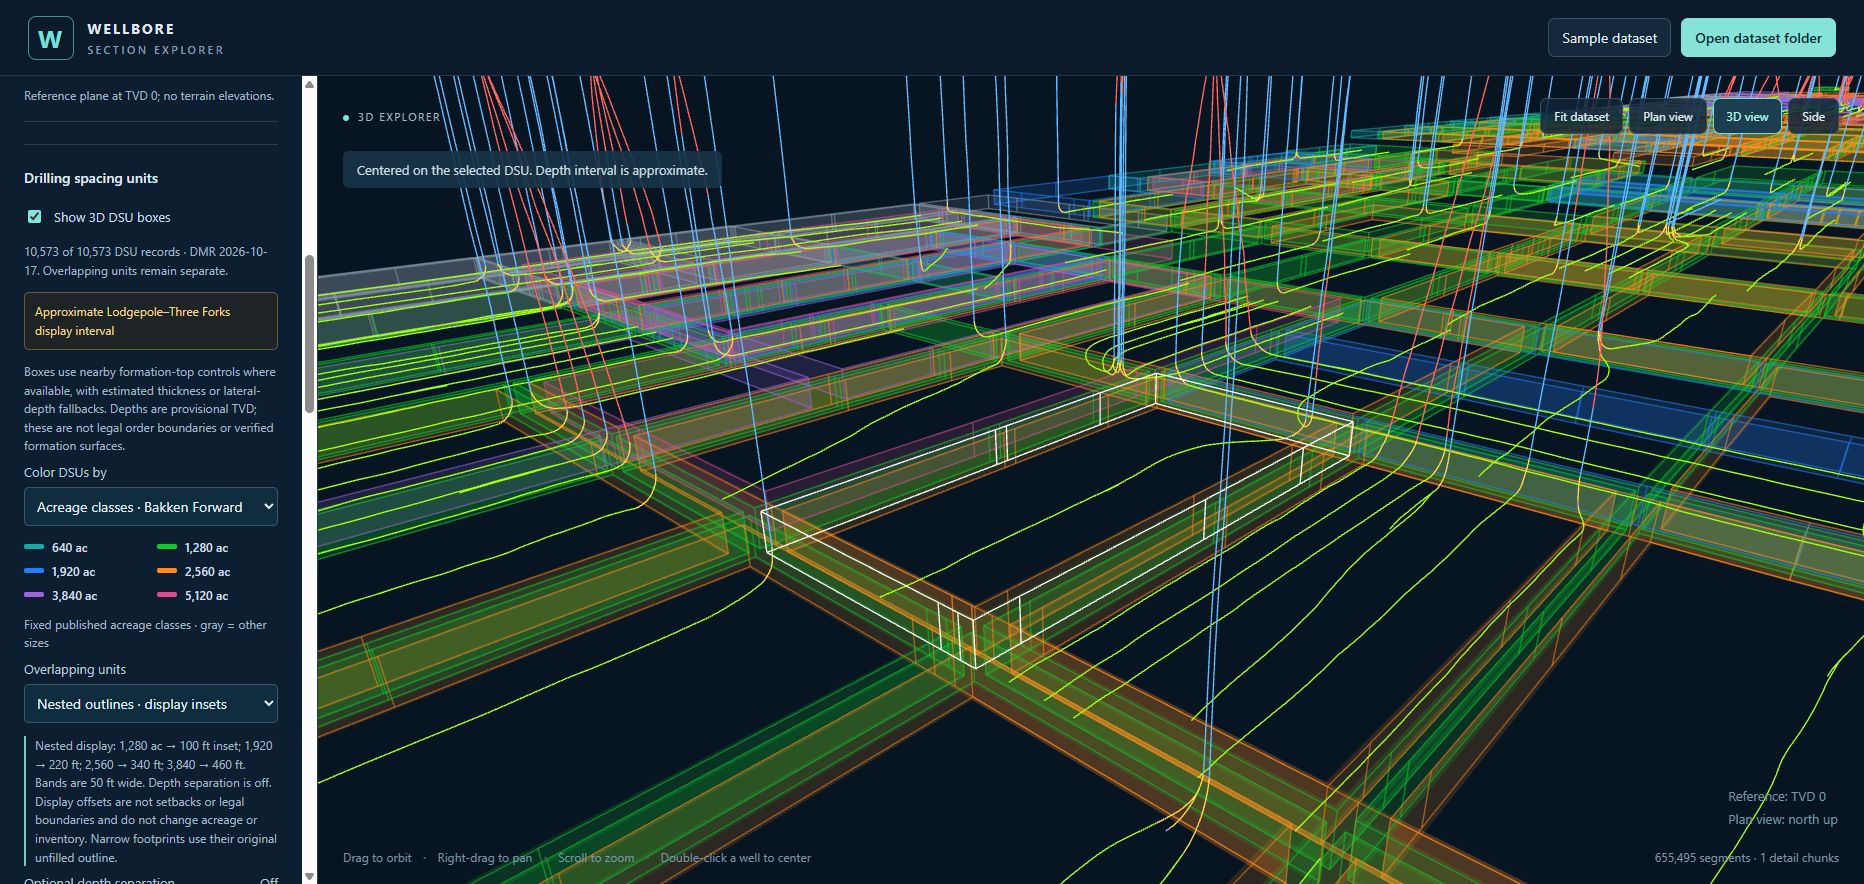
North Dakota · A subsurface perspective
Public well data, brought into view. Explore the paths, production, and patterns beneath North Dakota in an interactive 3D environment.
Explore the field
A well is more than a point on a surface map. Move around its full trajectory, follow changes along the path, and see how it fits into the surrounding field.
Open the interactive viewerNavigate classified well sections in 3D. Switch between azimuth, inclination, curvature, tortuosity, and dogleg severity (DLS) to explore variation along the mapped wellbore.
Mouse navigation · Section colors · Zoom to wellPlay monthly oil production over time and see lateral size respond to reported volumes. Put production history into the same spatial view as the wells.
Monthly playback · Production data through December 2024Start with North Dakota, zoom into a group of wells, and compare operator colors. Add drilling spacing units and township boundaries to understand the surrounding geography.
State boundary · Operators · DSUs · TownshipsCompare mapped lateral footage with adjustable capacity densities across DSUs and townships. See how the apparent development balance changes with each illustrative scenario.
Mapped footage · Adjustable density · Visible limitationsThe interpretation matters
A useful view should make its inputs and limits understandable. The methodology explains how geometry, production, and spatial measures become the layers you see.
Read the methodologySection classifications and engineering color views are derived from mapped paths. They are a way to explore the data, with resolution and source limitations.
Historical reported production adds a time dimension. A production display does not establish a completed interval or a well’s current status.
Footage capacity densities are illustrative, not calibrated forecasts. A footage balance is not a count of drillable locations, reserves, or a drilling schedule.
Rooted in North Dakota
Built from a passion for North Dakota and the Bakken—and a belief that public data becomes more useful when people can see it.
Bakken Subsurface Analytics is an independent project that turns public well information into an approachable visual experience. The goal is to make the field easier to explore, its patterns easier to discuss, and the assumptions behind each view easier to understand.
Your next perspective