
North Dakota · Bakken · In charts
The Bakken in charts
How the Bakken's wells come on, decline and keep producing, year after year: oil by the year each well first produced, the treadmill of new wells it takes to stand still, the shape of a Bakken decline, the days lost to weather and shut-ins, and the gas captured instead of flared.
Production through August 2026 Pools Bakken, Three Forks and Sanish Page built November 9, 2026
The Bakken lights up
Every horizontal Bakken well, lit in the month it first produced, from January 2006 to August 2026. Each lateral flashes white, then settles into the colour of its year: deep blue for the first wells of the boom, lime for the newest. Alongside, the basin's oil builds up by the year each well first produced.
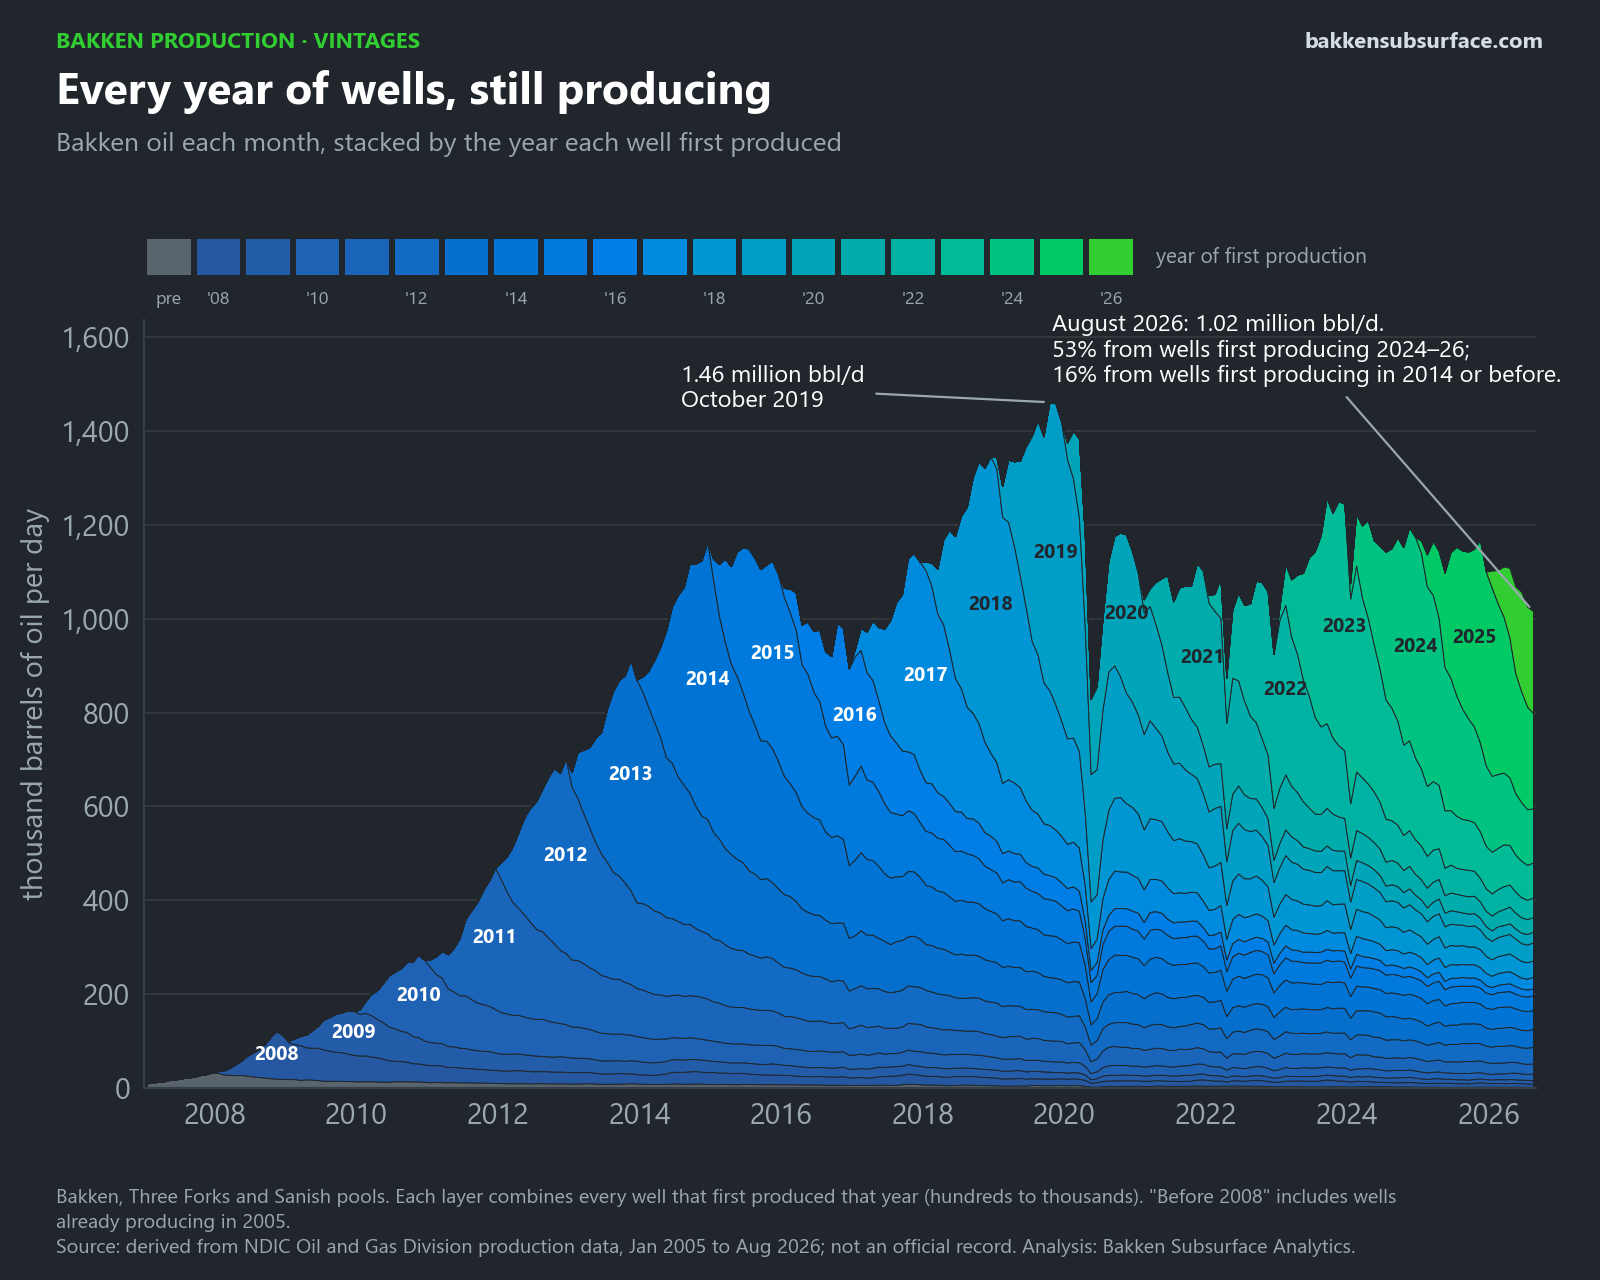
Every year of wells, still producing
Bakken oil each month, stacked by the year each well first produced. Output peaked at 1.46 million barrels a day in October 2019. In August 2026, 53% of the oil came from wells that started in 2024 to 2026, and 16% from wells that started in 2014 or earlier. Statewide figures, all pools included, are on Bakken Pulse.
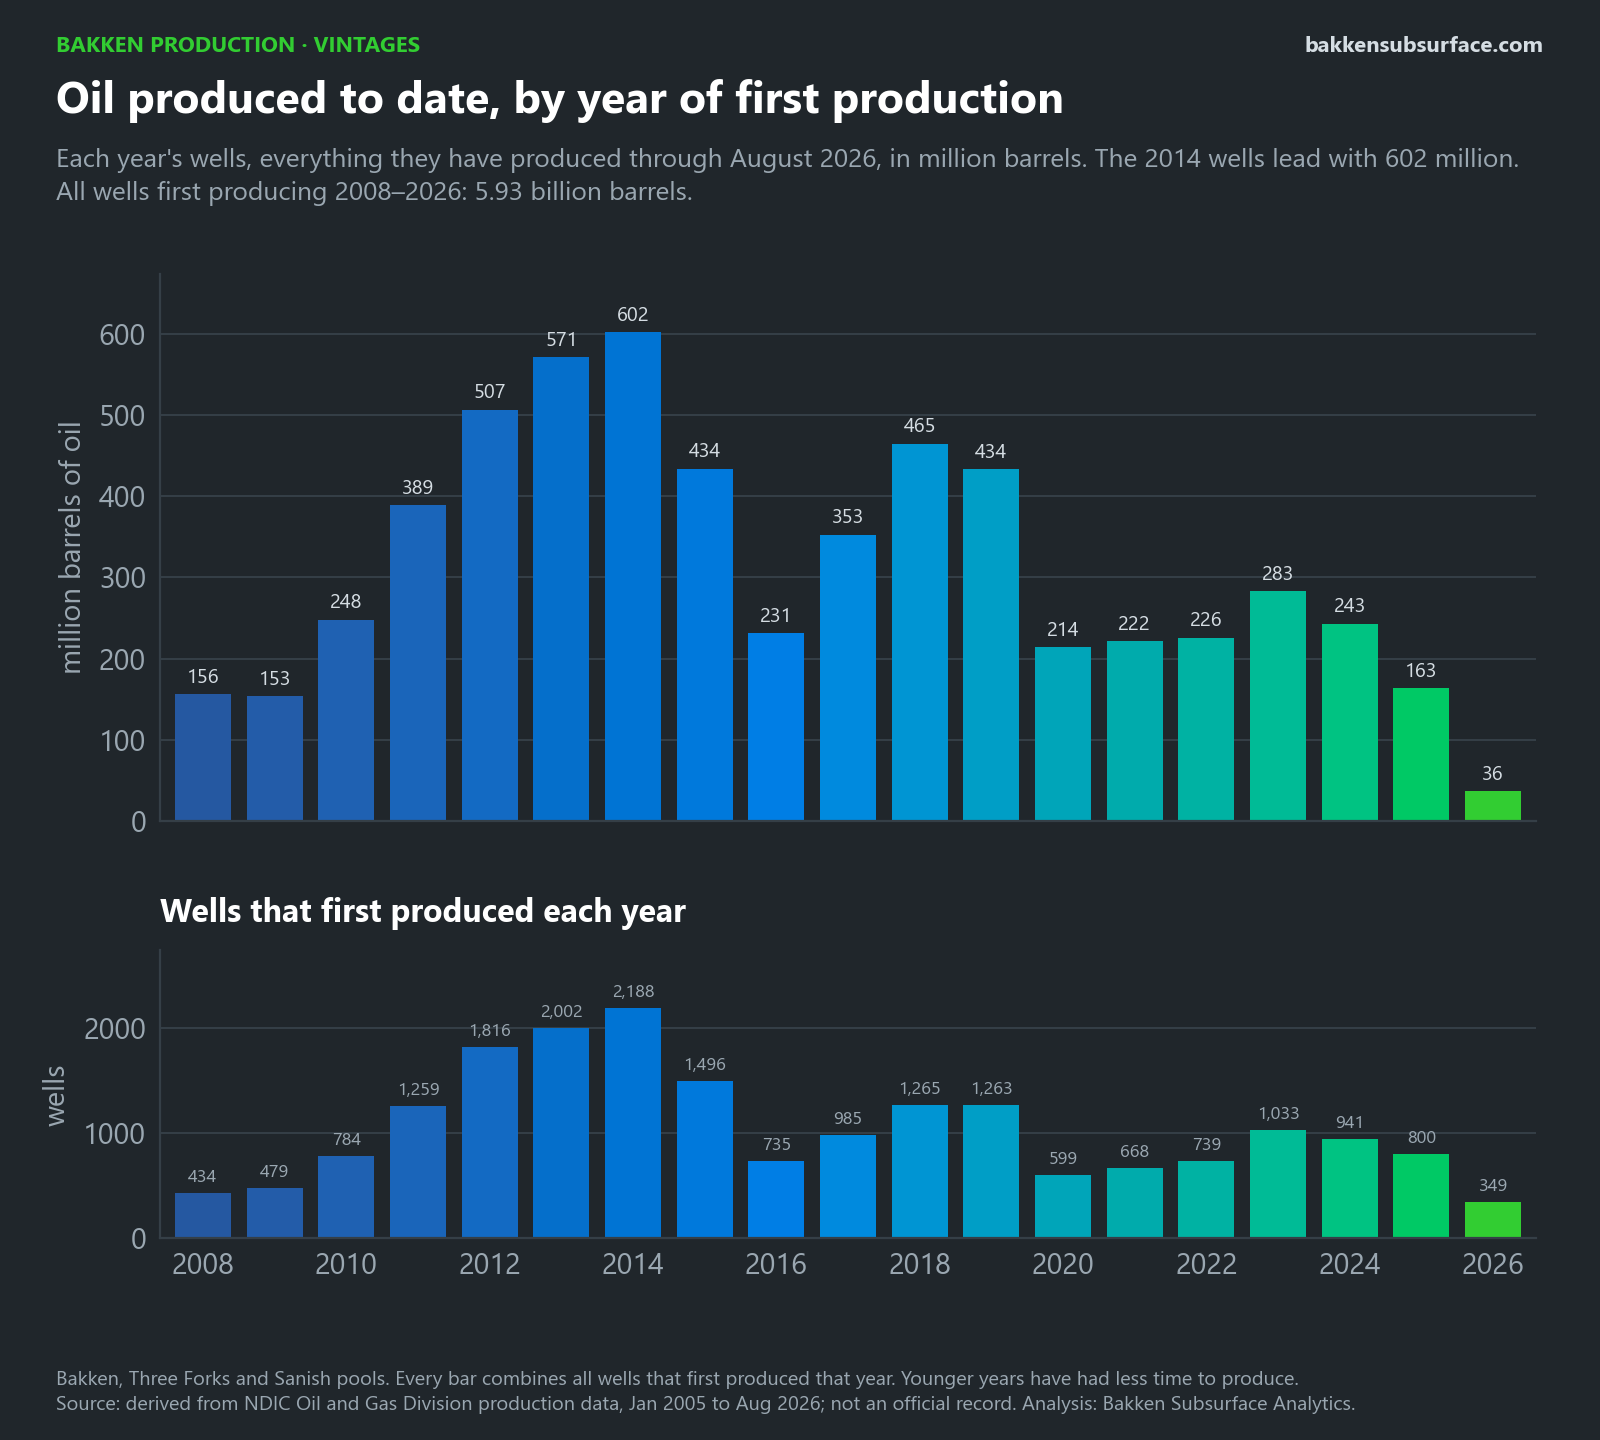
Oil produced to date, by year of first production
Everything each year's wells have produced through August 2026. The wells that started in 2014 lead with 602 million barrels; 2014 also brought the most wells online, 2,188. Together, the wells first producing since 2008 have made 5.93 billion barrels. Younger years have simply had less time.
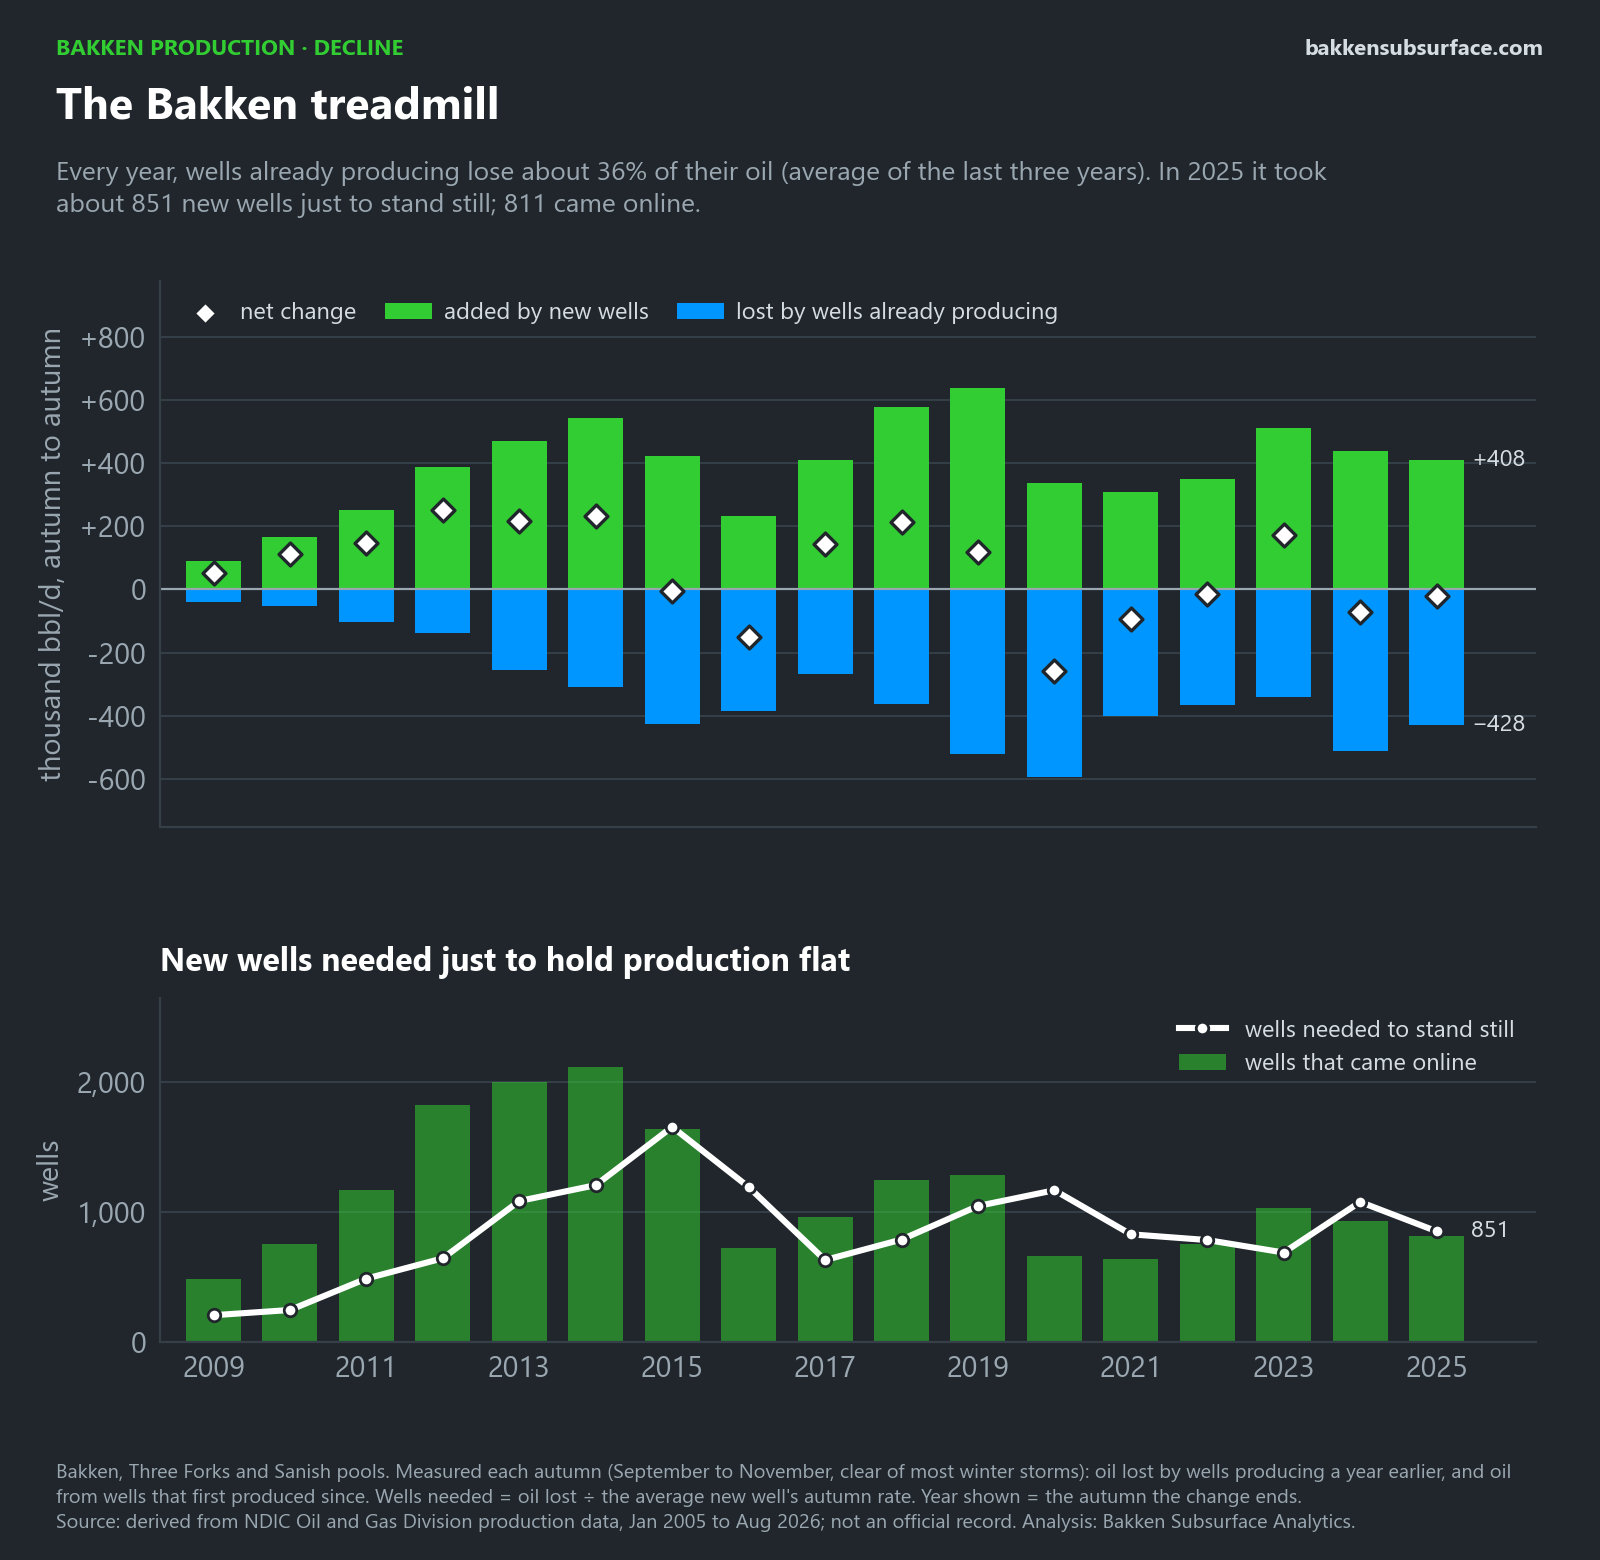
The Bakken treadmill
Every autumn, the wells already producing make about a third less oil than they did a year earlier: 36% less on average over the last three years. New wells have to replace that before the basin can grow. In 2025 it took about 851 new wells just to hold production flat; 811 came online, and output slipped by about 20,000 barrels a day.
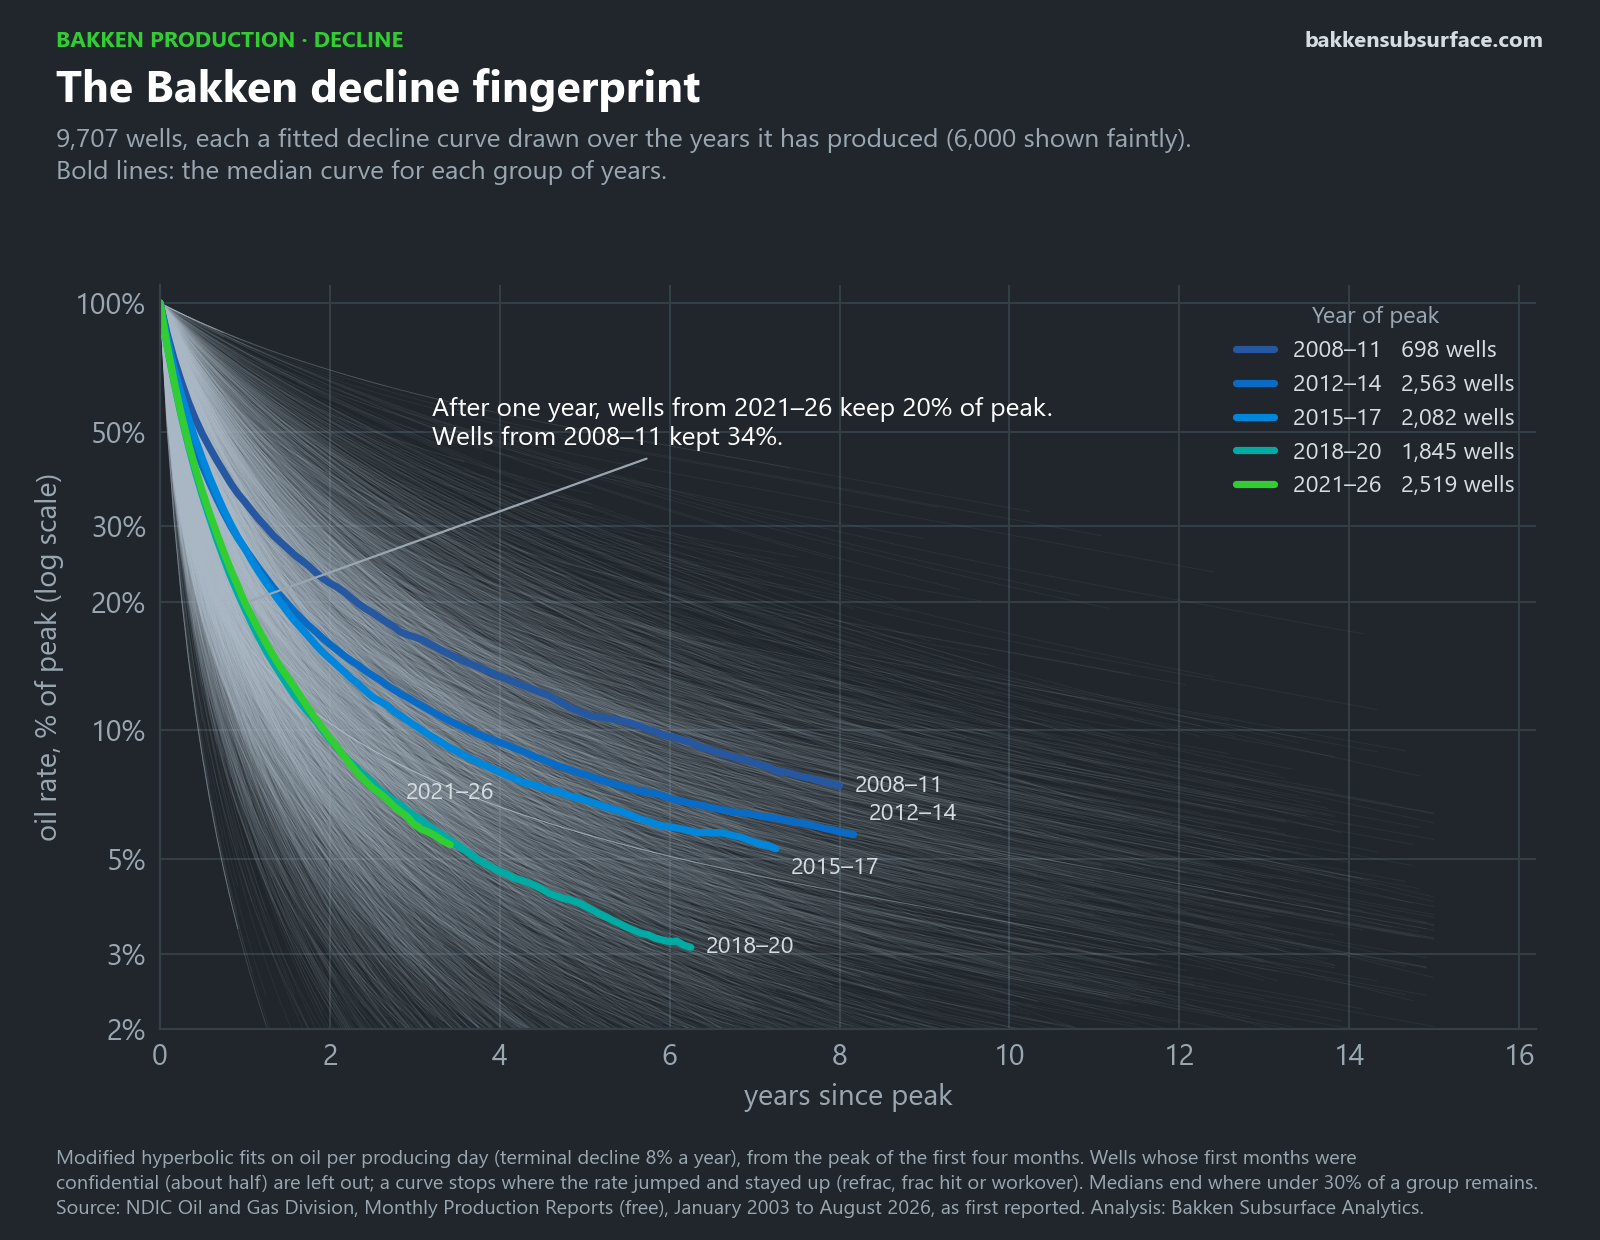
The Bakken decline fingerprint
9,707 Bakken wells, each drawn faintly as its fitted decline curve over the years it has produced, with the median curve for each group of years in bold. After one year, wells that peaked in 2021 to 2026 keep about 20% of their peak rate; wells from 2008 to 2011 kept 34%. These are the shapes of the basin's declines, not a forecast for any well.
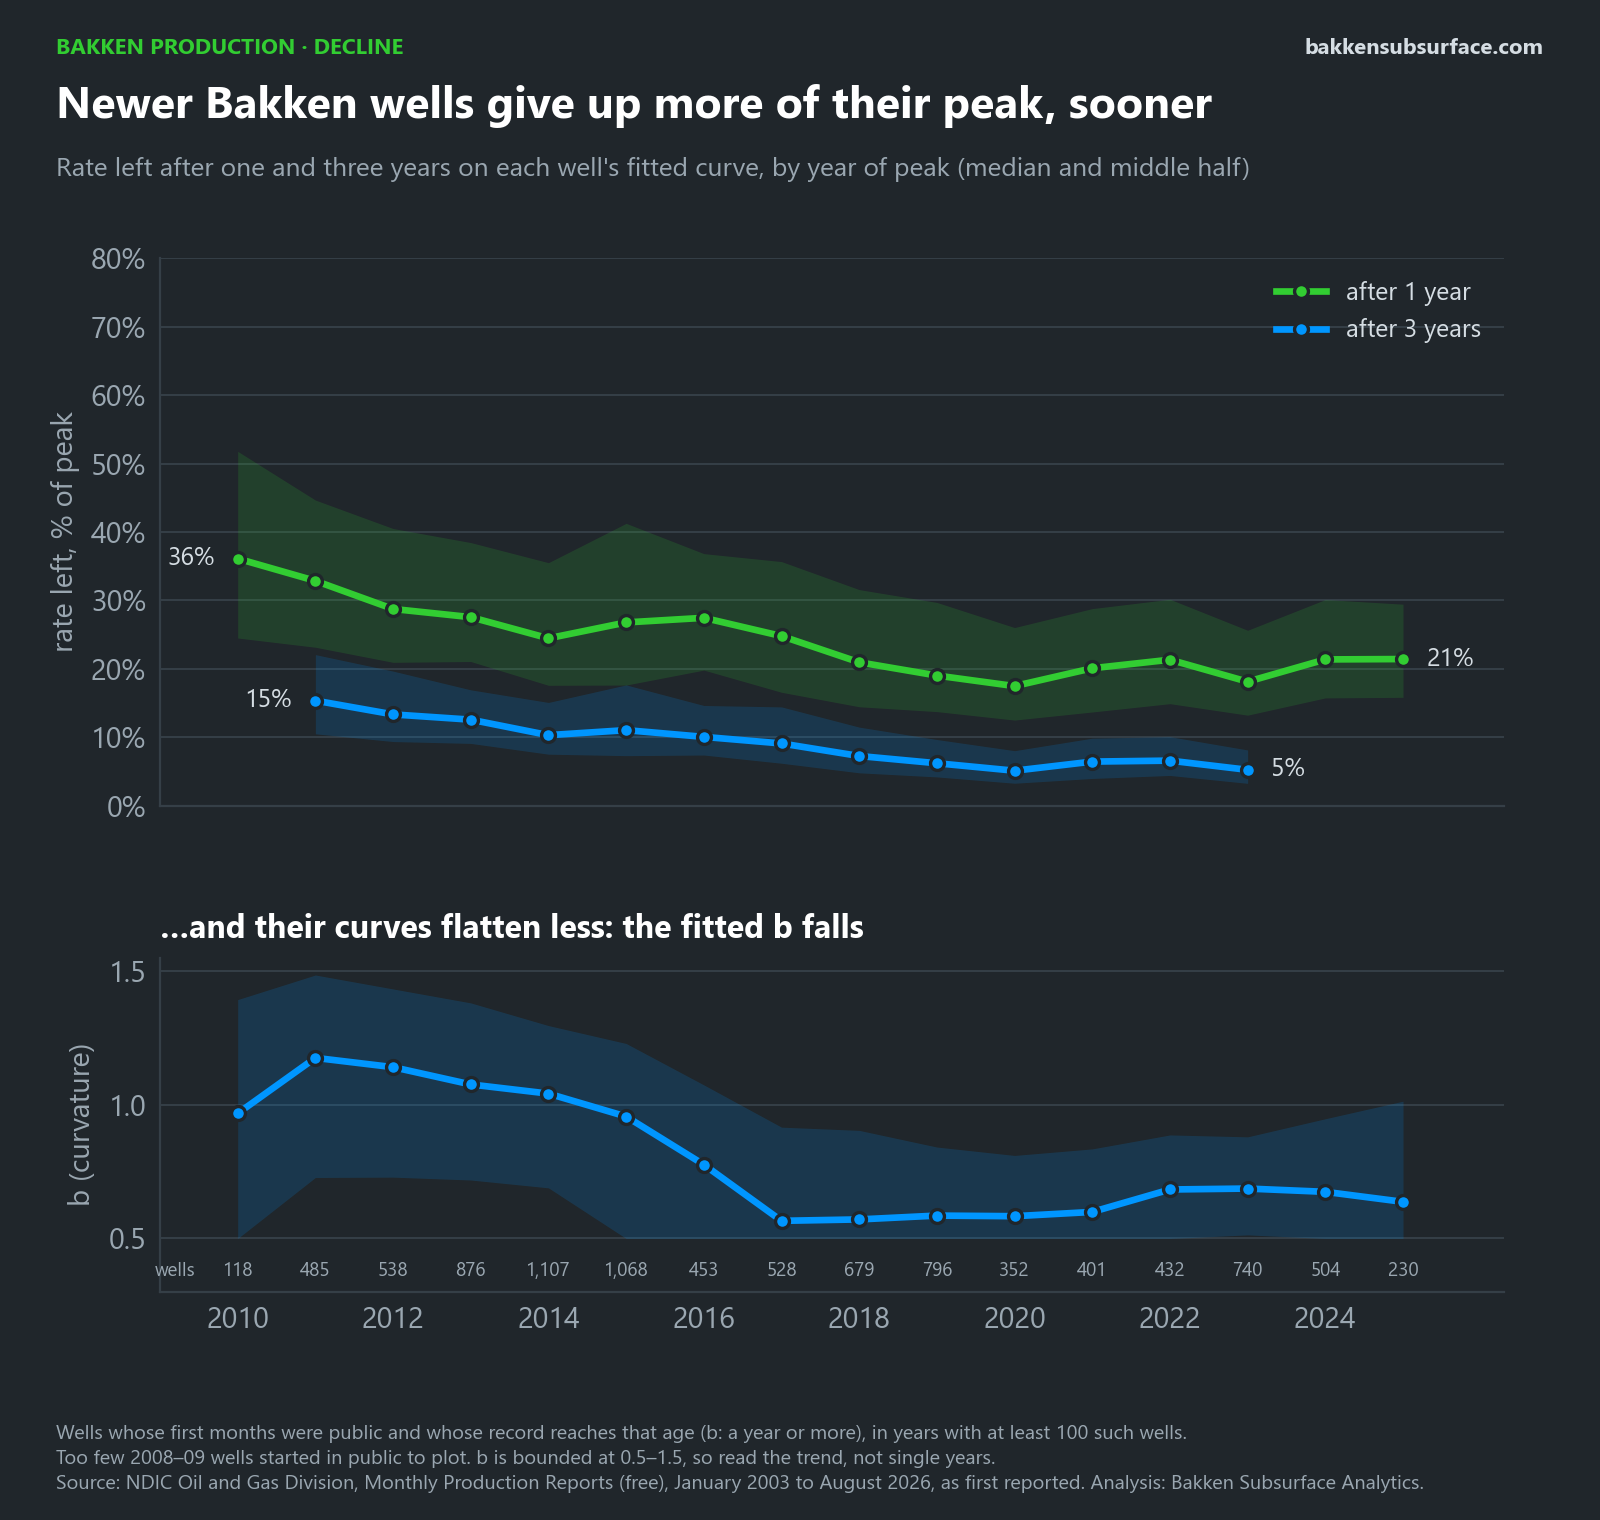
Newer wells give up more of their peak, sooner
The share of the peak rate left after one year fell from 36% for wells that peaked in 2010 to about 18 to 21% since 2018. The fitted b, the curvature that slows a decline over time, fell from about 1.1 to about 0.6. Newer wells come on harder and give up more of it early.
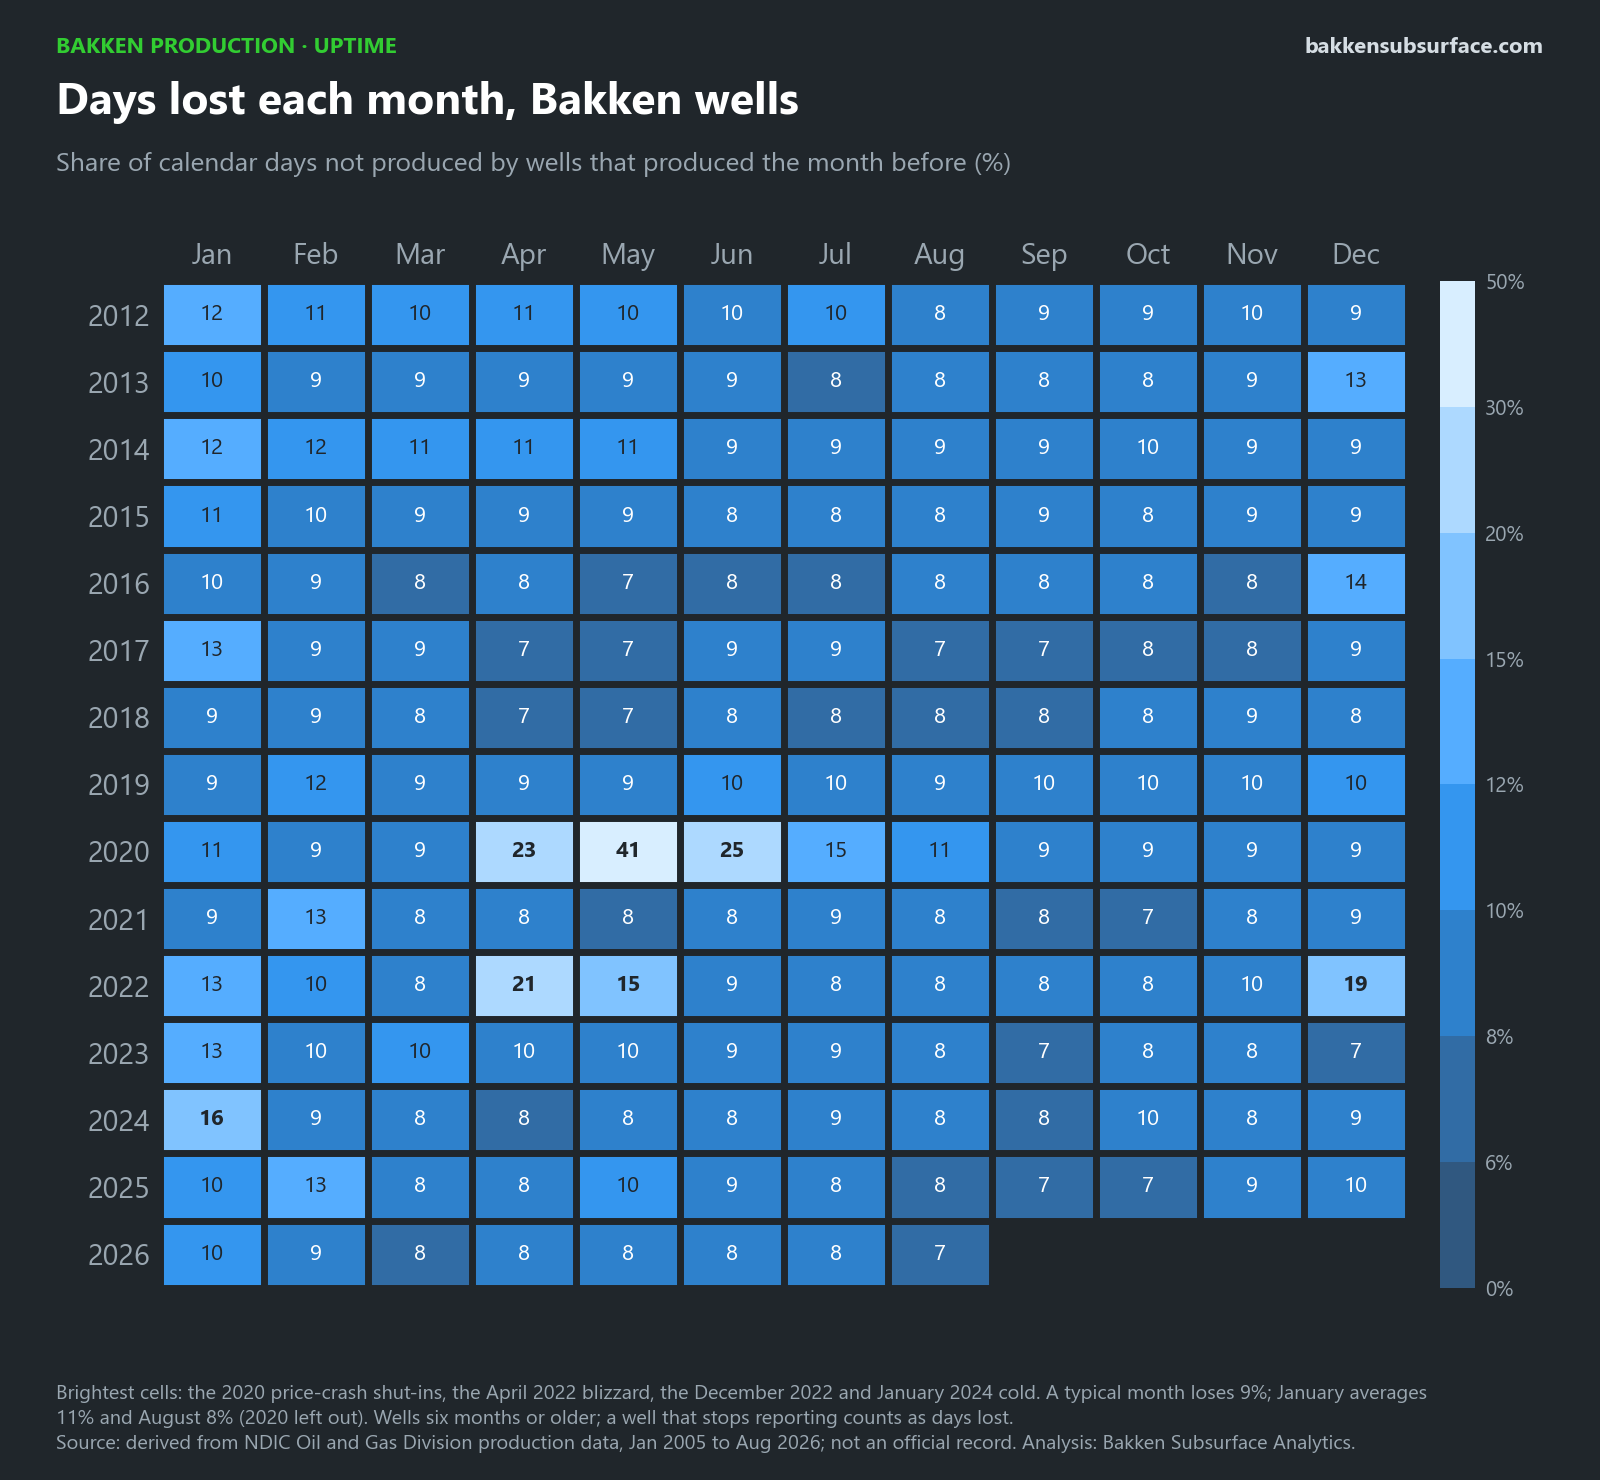
Days lost each month
The share of calendar days that producing wells did not produce. A typical month loses about 9%; January averages 11% and August 8%. The 2020 price-crash shut-ins took 41% of May's days. The April 2022 blizzard took 21%, the December 2022 cold 19% and the January 2024 cold 16%.
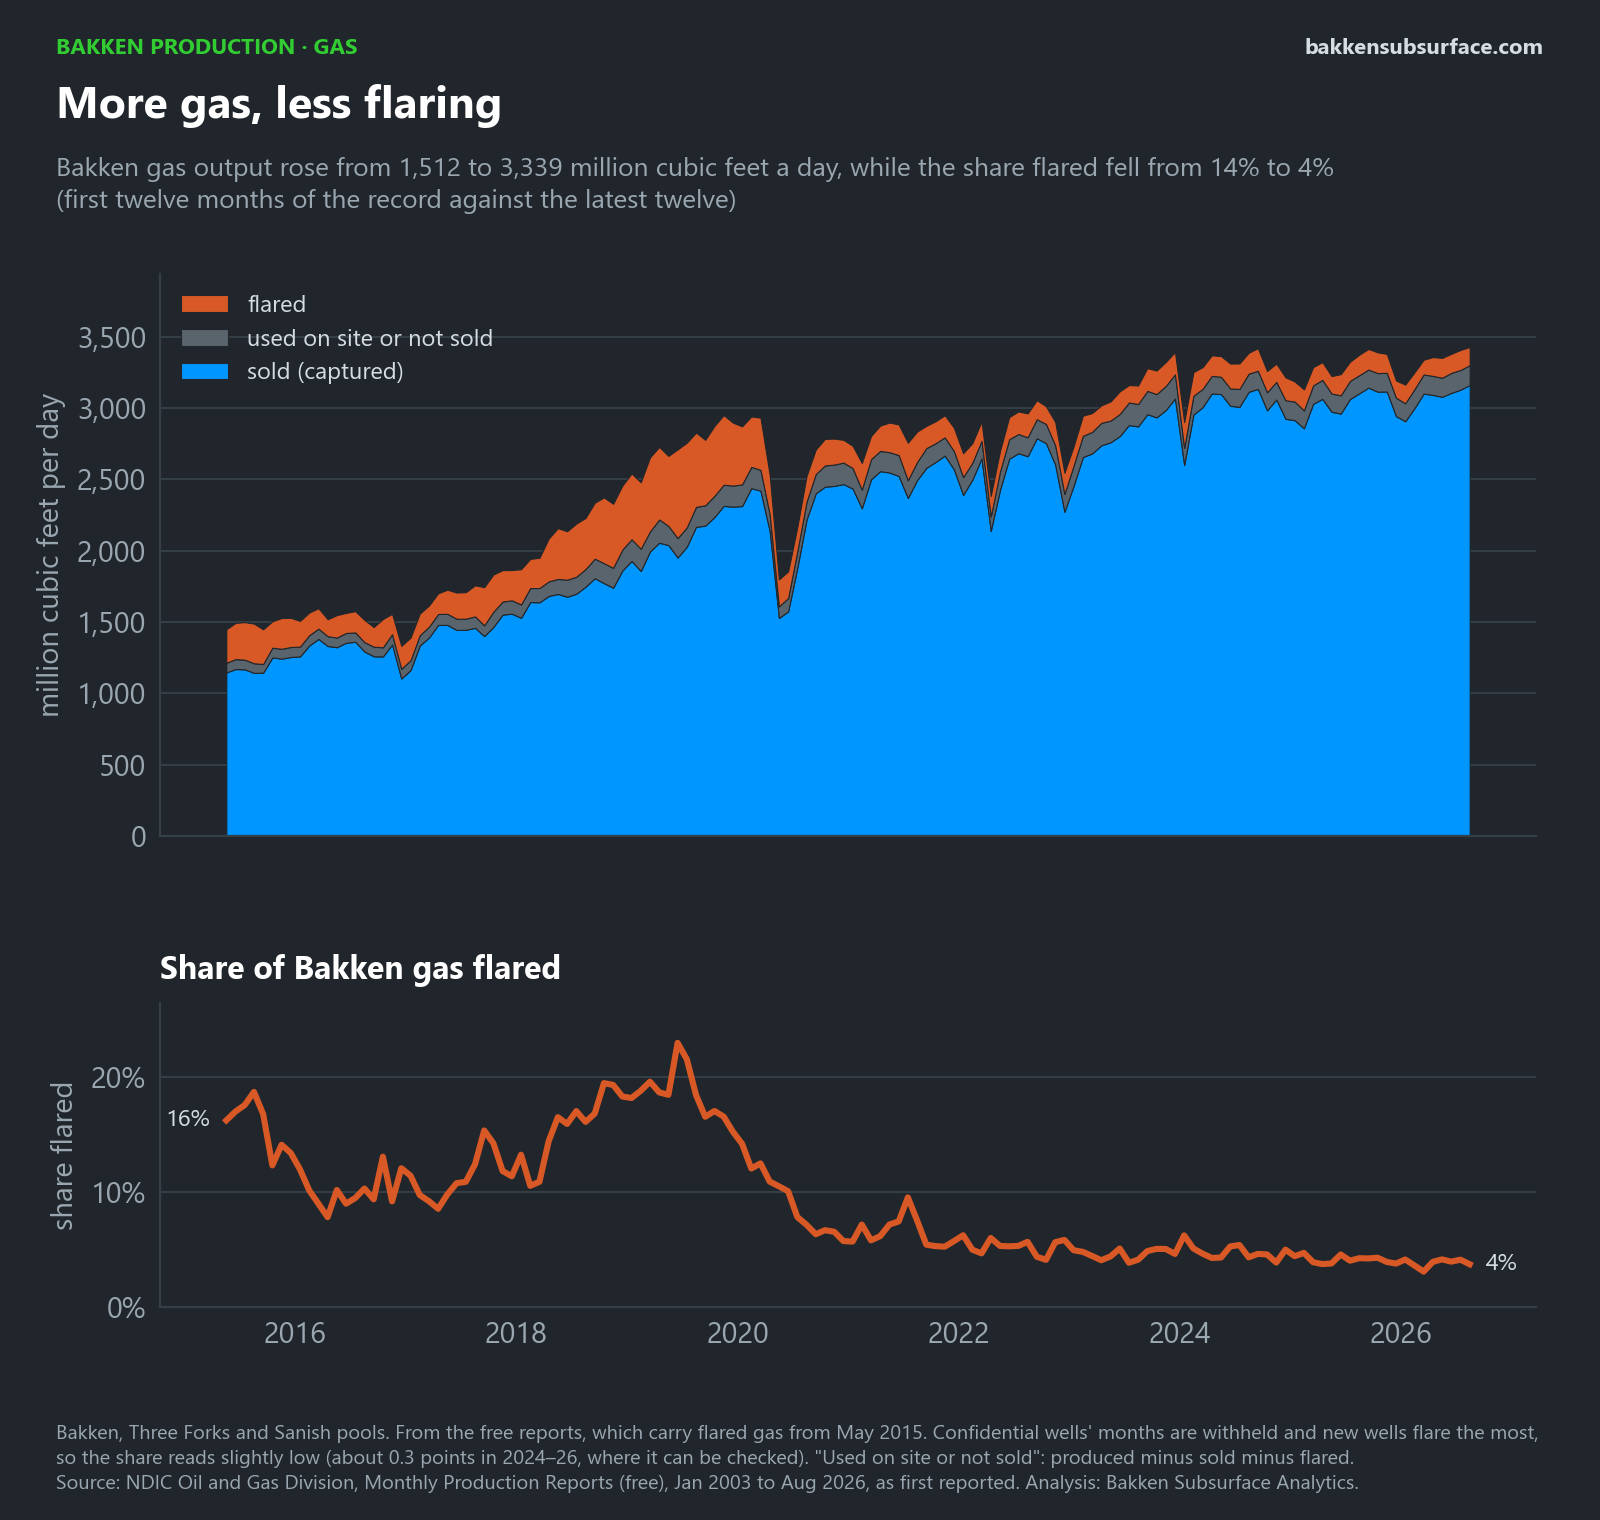
More gas, less flaring
Bakken gas output more than doubled, from about 1,500 to 3,340 million cubic feet a day, while the share flared fell from 14% to 4%, after a spike to 23% in mid-2019. The state's monthly flaring figures are on Bakken Pulse.
About these charts
Two kinds of source
- Free public records: the North Dakota Industrial Commission's Monthly Production Reports, as first reported (decline fingerprint, how wells changed, flaring, and the month each well lights up); the Department of Mineral Resources GIS horizontals layer (well paths); U.S. Census Bureau county lines.
- Derived from NDIC production records: the basin totals (vintages, oil to date, the treadmill, days lost, and the oil and well counts beside the map). Every figure combines hundreds to thousands of wells, so no single well's volumes can be read from them. They are not an official record of the State of North Dakota.
Why two sources
The free monthly reports withhold the volumes of confidential wells for their first months, which is 5 to 12% of each month's Bakken oil and mostly new wells at their highest rates. Basin totals built from the free reports alone would run low, so they come from the full record. The curves, which are drawn well by well, come only from the free reports.
Method
- Pools: Bakken, Three Forks and Sanish. Year of first production: the first month a well reported oil.
- Decline curves: modified hyperbolic fits on oil per producing day, from the peak of the first four months, with b between 0.5 and 1.5 and a terminal decline of 8% a year. A curve stops where the rate jumped and stayed up, as after a refrac, a frac hit or a workover.
- The treadmill compares each autumn (September to November) with the one before. Oil added minus oil lost equals the change in output exactly.
Limits
- Values are as reported; the newest months are the most likely to be revised by operators' later filings.
- Nothing here is a forecast, an estimate of reserves or advice about any well, lease or company.
Using the charts
Each chart opens full size as a PNG. If you share one, credit Bakken Subsurface Analytics, keep its source line and date, and do not present it as an official record, as the terms of use ask.